Unveiling EQT (EQT)'s Value: Is It Really Priced Right? A Comprehensive Guide
EQT (NYSE:EQT) has seen a daily loss of -1.56% and a 3-month gain of 10.44%, with an Earnings Per Share (EPS) of 8.89. However, is the stock significantly overvalued? This comprehensive analysis seeks to answer this question by examining EQT's financial health, profitability, growth, and intrinsic value. We invite you to delve deeper into our findings.
Company Overview
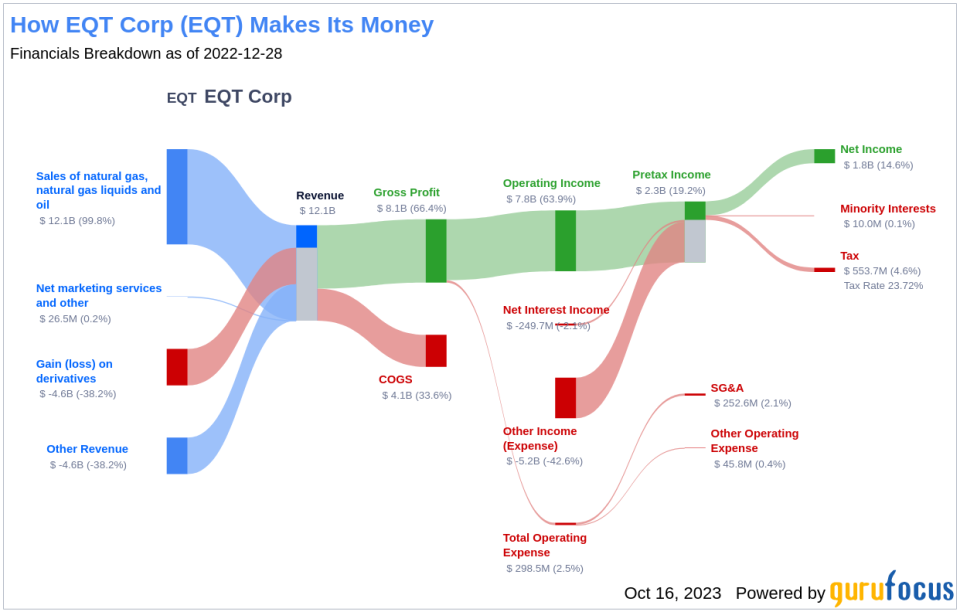
EQT Corp is an independent natural gas production company with operations focused in the cores of the Marcellus and Utica shales in the Appalachian Basin. The firm focuses on executing combo-development projects for developing multiwell pads to meet supply needs, with a focus on maximizing operational efficiency, technology, and sustainability. Its main customers include marketers, utilities, and industrial operators in the Appalachian Basin. The company has one reportable segment and its revenue stems from three types of gas reserves: natural gas, natural gas liquids, and crude oil. All of the firm's operating revenue is generated in the U.S., with most revenue flowing from the Marcellus Shale field and through the sale of natural gas.
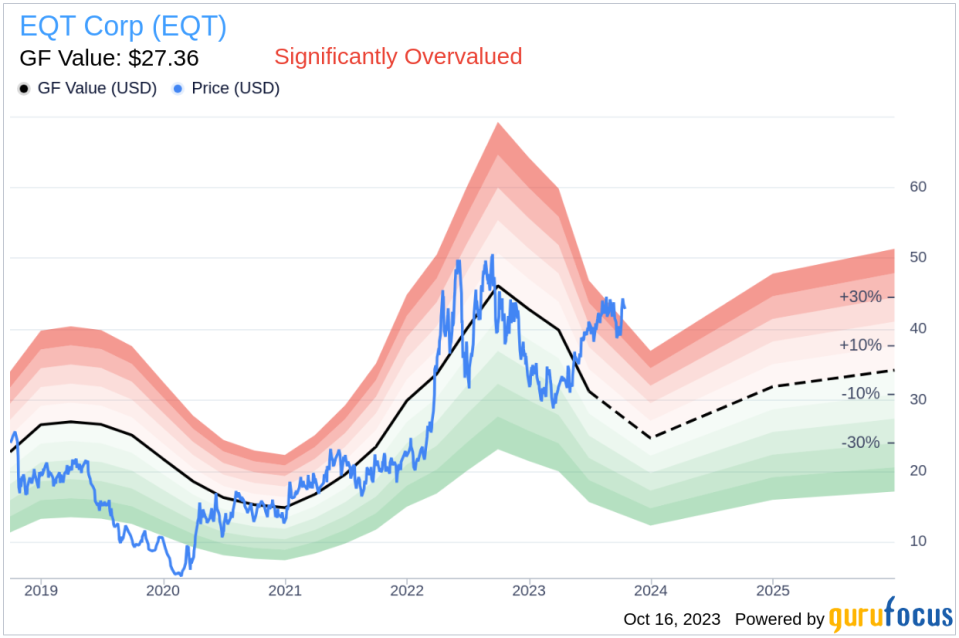
At its current price of $42.69 per share and a market cap of $17.60 billion, EQT's stock appears to be significantly overvalued when compared to the GF Value of $27.36, which is a proprietary estimation of its fair value.
Understanding the GF Value
The GF Value is a unique measure that offers an estimation of a stock's intrinsic value. It is calculated based on historical trading multiples, a GuruFocus adjustment factor based on past performance and growth, and future business performance estimates. The GF Value Line provides an overview of the stock's fair trading value. If the stock price is significantly above the GF Value Line, it is overvalued and its future return is likely to be poor. Conversely, if it is significantly below the GF Value Line, its future return will likely be higher.
For EQT, the stock is estimated to be significantly overvalued according to the GF Value calculation. As a result, the long-term return of its stock is likely to be much lower than its future business growth.
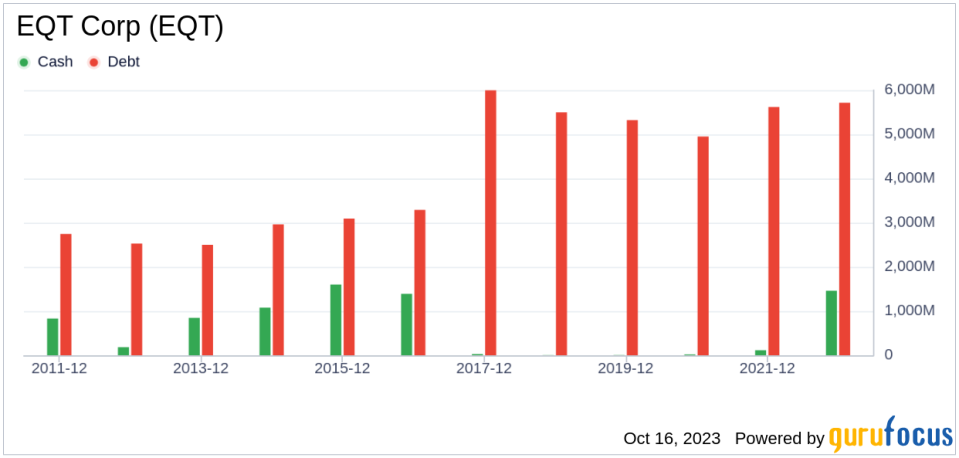
Financial Strength
Investing in companies with strong financial strength reduces the risk of permanent loss. A company's cash-to-debt ratio and interest coverage are good indicators of its financial strength. EQT has a cash-to-debt ratio of 0.26, which is worse than 63.53% of 1031 companies in the Oil & Gas industry. The overall financial strength of EQT is 6 out of 10, indicating fair financial health.
Profitability and Growth
Investing in profitable companies, especially those with consistent long-term profitability and high profit margins, poses less risk. Over the past 10 years, EQT has been profitable 5 times. Over the past twelve months, the company had a revenue of $9 billion and an Earnings Per Share (EPS) of $8.89. Its operating margin is 52.69%, which ranks better than 92.37% of 983 companies in the Oil & Gas industry. Overall, GuruFocus ranks EQT's profitability at 7 out of 10, indicating fair profitability.
Growth is a crucial factor in a company's valuation. EQT's 3-year average revenue growth rate is better than 78.79% of 858 companies in the Oil & Gas industry. EQT's 3-year average EBITDA growth rate is 137.6%, which ranks better than 97.81% of 821 companies in the Oil & Gas industry.
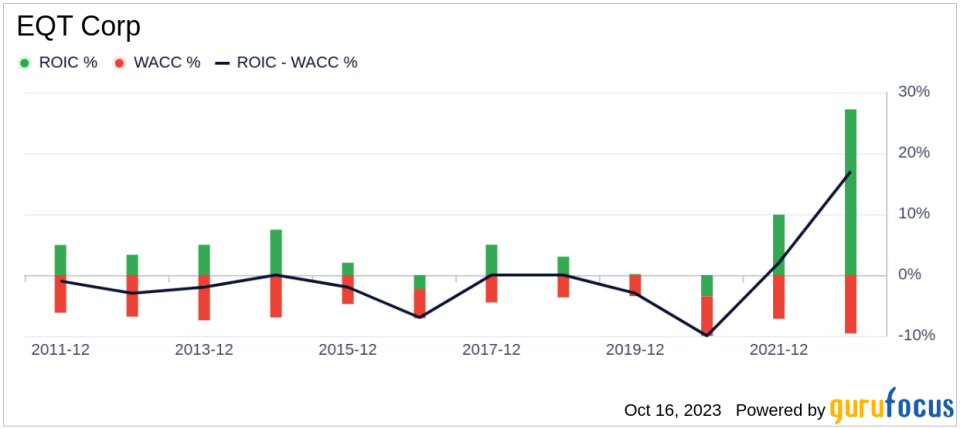
ROIC vs WACC
Return on invested capital (ROIC) measures how well a company generates cash flow relative to the capital it has invested in its business. The weighted average cost of capital (WACC) is the rate that a company is expected to pay on average to all its security holders to finance its assets. For the past 12 months, EQT's return on invested capital is 16.78, and its cost of capital is 7.66.
Conclusion
In summary, EQT's stock is estimated to be significantly overvalued. The company's financial condition and profitability are fair, and its growth ranks better than 97.81% of 821 companies in the Oil & Gas industry. To learn more about EQT stock, you can check out its 30-Year Financials here.
To find out the high quality companies that may deliver above average returns, please check out the GuruFocus High Quality Low Capex Screener.
This article, generated by GuruFocus, is designed to provide general insights and is not tailored financial advice. Our commentary is rooted in historical data and analyst projections, utilizing an impartial methodology, and is not intended to serve as specific investment guidance. It does not formulate a recommendation to purchase or divest any stock and does not consider individual investment objectives or financial circumstances. Our objective is to deliver long-term, fundamental data-driven analysis. Be aware that our analysis might not incorporate the most recent, price-sensitive company announcements or qualitative information. GuruFocus holds no position in the stocks mentioned herein.
This article first appeared on GuruFocus.
