Unveiling EQT (EQT)'s Value: Is It Really Priced Right? A Comprehensive Guide
The stock of EQT Corp (NYSE:EQT) has gained 2.75% in the recent trading session and has shown a slight increase of 0.17% over the last three months. The company's Earnings Per Share (EPS) (EPS) stands at 8.89. But the question is, is the stock significantly overvalued? In this article, we will delve into the valuation analysis of EQT (NYSE:EQT) and provide insights into its intrinsic value.
Company Introduction
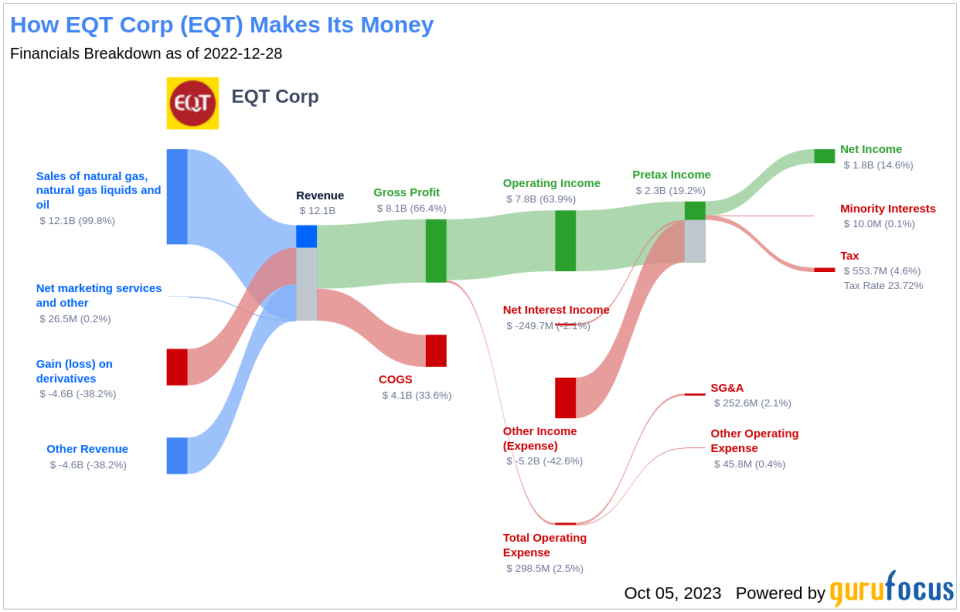
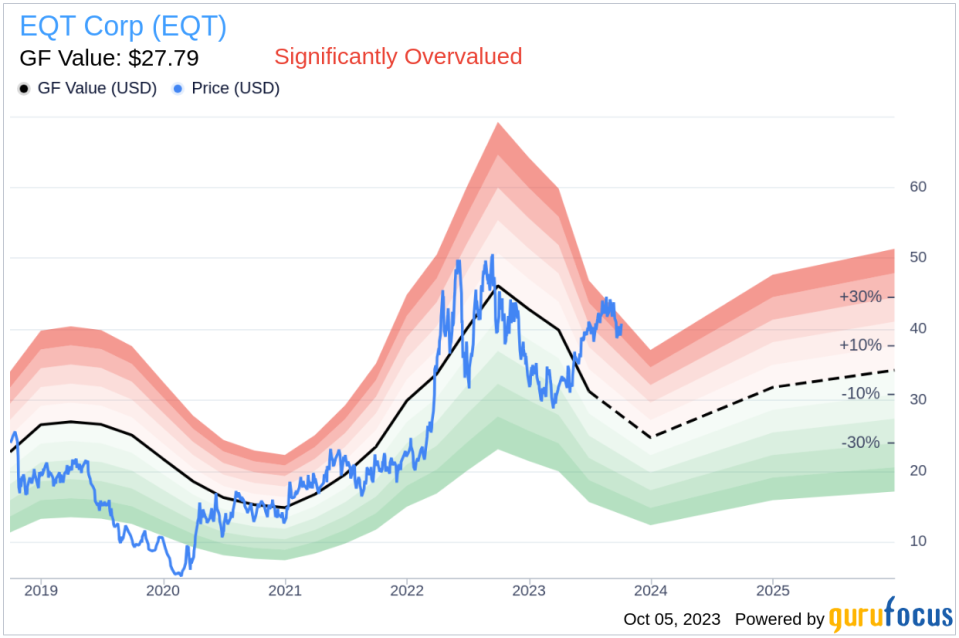
EQT Corp is an independent natural gas production company with operations focused in the cores of the Marcellus and Utica shales in the Appalachian Basin. The company's main customers include marketers, utilities, and industrial operators in the Appalachian Basin. EQT's operating revenue is generated entirely in the U.S., with the majority flowing from the Marcellus Shale field and through the sale of natural gas. The company's stock price is currently at $40.74, while its estimated fair value (GF Value) stands at $27.79, indicating that the stock might be significantly overvalued.
Understanding the GF Value
The GF Value is a proprietary measure that represents the current intrinsic value of a stock. It is derived from historical multiples, a GuruFocus adjustment factor based on the company's past performance and growth, and future business performance estimates. The GF Value Line provides an overview of the fair value at which the stock should ideally be traded. If the stock price is significantly above the GF Value Line, it is overvalued, and its future return is likely to be poor. On the other hand, if it is significantly below the GF Value Line, its future return will likely be higher.
For EQT (NYSE:EQT), the stock seems to be significantly overvalued based on the GF Value. At its current price of $40.74 per share, EQT has a market cap of $16.80 billion. Therefore, the long-term return of its stock is likely to be much lower than its future business growth.
Link: These companies may deliver higher future returns at reduced risk.
Financial Strength
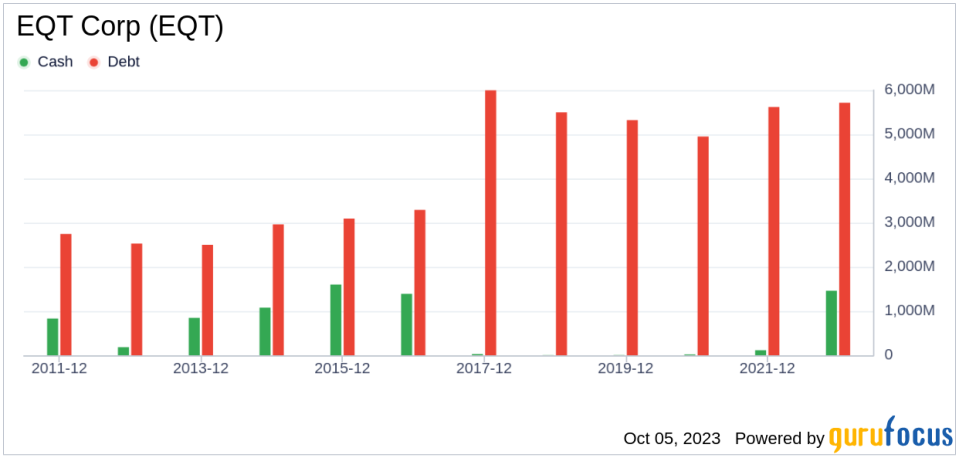
Before investing in a company, it is essential to check its financial strength. Companies with poor financial strength have a higher risk of permanent loss. The cash-to-debt ratio and interest coverage are great ways to understand a company's financial strength. EQT has a cash-to-debt ratio of 0.26, which is worse than 63.52% of 1028 companies in the Oil & Gas industry. The overall financial strength of EQT is 6 out of 10, indicating fair financial strength.
Profitability and Growth
Investing in profitable companies poses less risk, especially those that have demonstrated consistent profitability over the long term. Companies with high profit margins are typically safer investments than those with low profit margins. EQT has been profitable for 5 out of the past 10 years. Over the past twelve months, the company had a revenue of $9 billion and Earnings Per Share (EPS) of $8.89. Its operating margin is 52.69%, which ranks better than 92.25% of 981 companies in the Oil & Gas industry. Overall, GuruFocus ranks EQT's profitability at 7 out of 10, indicating fair profitability.
Growth is probably the most important factor in the valuation of a company. The faster a company is growing, the more likely it is to be creating value for shareholders, especially if the growth is profitable. The 3-year average annual revenue growth rate of EQT is 26.1%, which ranks better than 79.16% of 859 companies in the Oil & Gas industry. The 3-year average EBITDA growth rate is 137.6%, which ranks better than 97.82% of 826 companies in the Oil & Gas industry.
ROIC vs WACC
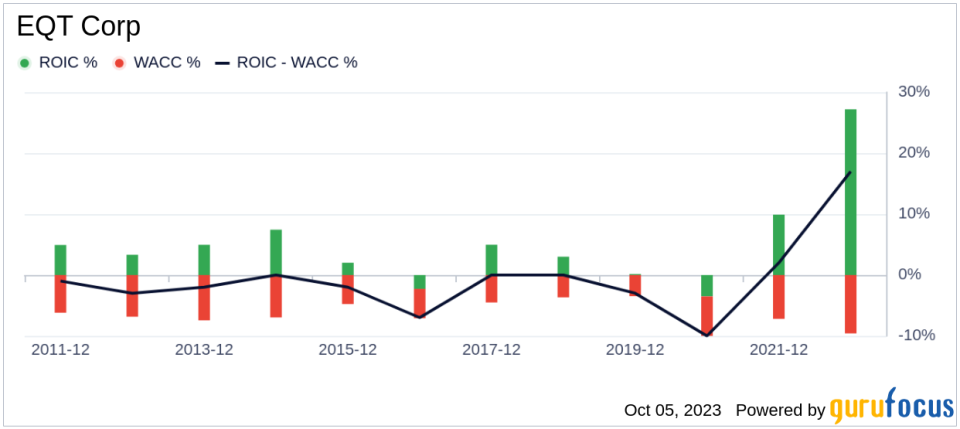
Evaluating a company's profitability can also be done by comparing its return on invested capital (ROIC) to its weighted average cost of capital (WACC). Return on invested capital (ROIC) measures how well a company generates cash flow relative to the capital it has invested in its business. The weighted average cost of capital (WACC) is the rate that a company is expected to pay on average to all its security holders to finance its assets. If the return on invested capital exceeds the weighted average cost of capital, the company is likely creating value for its shareholders. During the past 12 months, EQT's ROIC was 16.78 while its WACC came in at 7.59.
Conclusion
In conclusion, the stock of EQT (NYSE:EQT) shows every sign of being significantly overvalued. The company's financial condition and profitability are fair, and its growth ranks better than 97.82% of the companies in the Oil & Gas industry. To learn more about EQT stock, you can check out its 30-Year Financials here.
To find out the high-quality companies that may deliver above-average returns, please check out the GuruFocus High Quality Low Capex Screener.
This article first appeared on GuruFocus.
