Unveiling Grupo Simec SAB de CV (SIM)'s Value: Is It Really Priced Right? A Comprehensive Guide
Grupo Simec SAB de CV (SIM) recently recorded a daily gain of 1.82%, and a 3-month gain of 2.32%. The company's Earnings Per Share (EPS) (EPS) stands at 1.16. However, the question that arises is, is the stock modestly overvalued? This article will delve into the valuation analysis of Grupo Simec SAB de CV to provide a comprehensive understanding of its intrinsic value. Read on to find out more.
Company Introduction
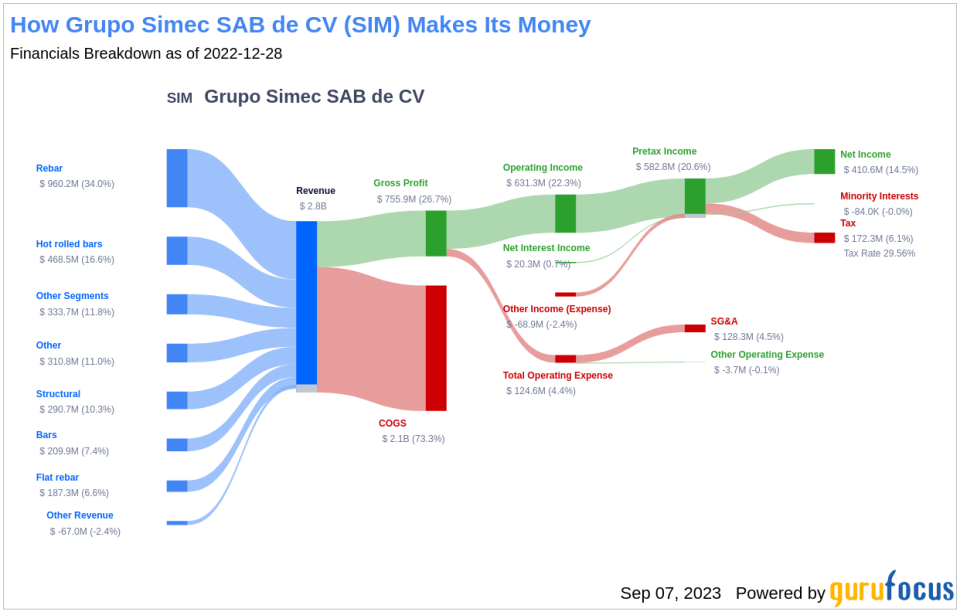
Grupo Simec SAB de CV is a diversified manufacturer, processor, and distributor of special bar quality (SBQ) steel, and structural steel products. The company's primary markets are the United States, Brazil, and Mexico. Its SBQ products are used across various engineered end-user applications, including axles, hubs, and crankshafts for automobiles and light trucks, machine tools, and off-highway equipment. The company's structural steel products are mainly used in the non-residential construction market and other construction applications.
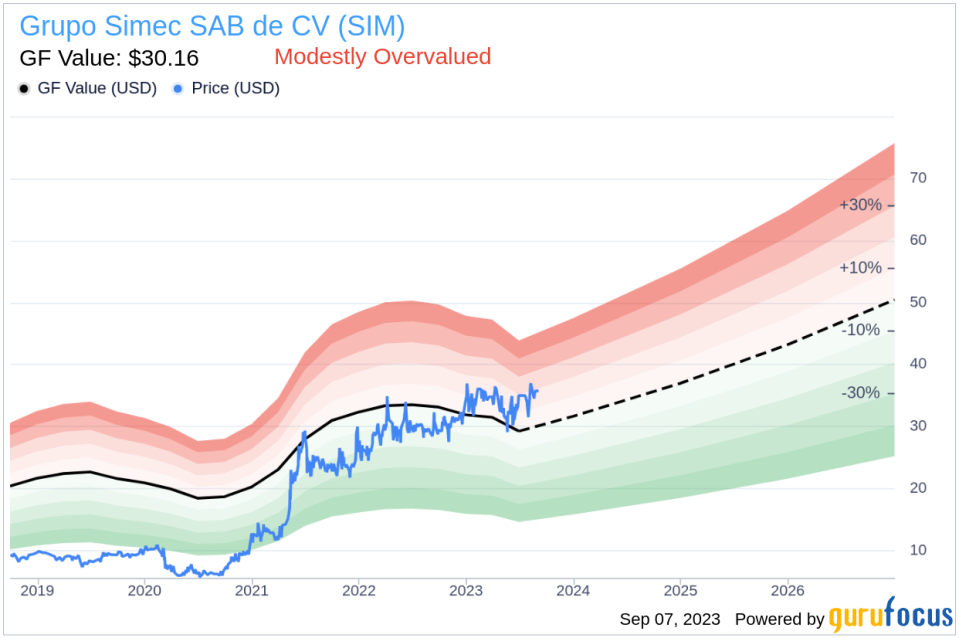
With a stock price of $35.76 and a GF Value of $30.16, Grupo Simec SAB de CV (SIM) appears to be modestly overvalued. The following is the income breakdown of Grupo Simec SAB de CV:
Summarizing GF Value
The GF Value represents the current intrinsic value of a stock derived from our exclusive method. The GF Value Line gives an overview of the fair value that the stock should be traded at. It is calculated based on three factors:
Historical multiples (PE Ratio, PS Ratio, PB Ratio, and Price-to-Free-Cash-Flow) that the stock has traded at.
GuruFocus adjustment factor based on the company's past returns and growth.
Future estimates of the business performance.
When the stock price is significantly above the GF Value Line, it is considered overvalued and its future return is likely to be poor. Conversely, if it is significantly below the GF Value Line, its future return will likely be higher. Currently, Grupo Simec SAB de CV's stock appears to be modestly overvalued with a market cap of $5.50 billion at its current price of $35.76 per share.
Because Grupo Simec SAB de CV is relatively overvalued, the long-term return of its stock is likely to be lower than its business growth.
Link: These companies may deliver higher future returns at reduced risk.
Financial Strength
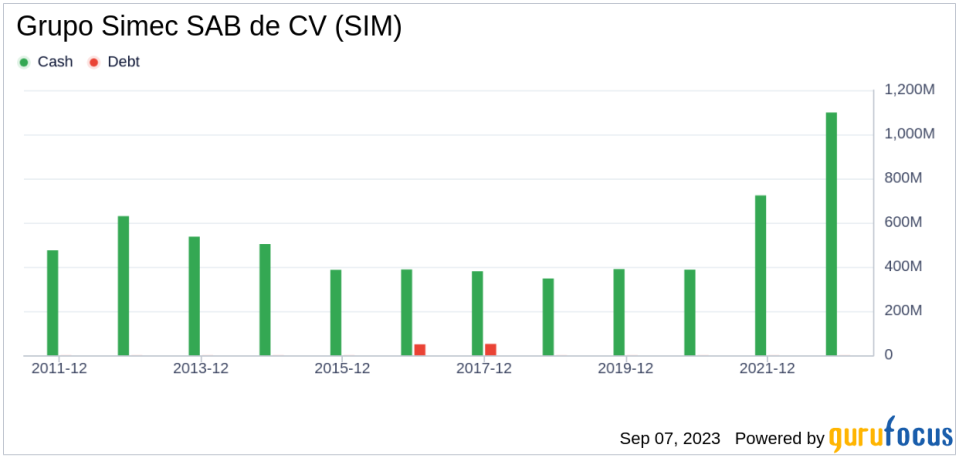
Companies with poor financial strength offer investors a high risk of permanent capital loss. To avoid this, an investor must review a company's financial strength before deciding to purchase shares. Both the cash-to-debt ratio and interest coverage of a company are great ways to understand its financial strength. Grupo Simec SAB de CV has a cash-to-debt ratio of 4034.96, which ranks better than 92.76% of 594 companies in the Steel industry. The overall financial strength of Grupo Simec SAB de CV is 10 out of 10, which indicates that the financial strength of Grupo Simec SAB de CV is strong.
This is the debt and cash of Grupo Simec SAB de CV over the past years:
Profitability and Growth
Investing in profitable companies carries less risk, especially in companies that have demonstrated consistent profitability over the long term. Typically, a company with high profit margins offers better performance potential than a company with low profit margins. Grupo Simec SAB de CV has been profitable 8 years over the past 10 years. During the past 12 months, the company had revenues of $2.50 billion and Earnings Per Share (EPS) of $1.16. Its operating margin of 20.36% is better than 93.07% of 592 companies in the Steel industry. Overall, GuruFocus ranks Grupo Simec SAB de CV's profitability as strong.
Growth is probably the most important factor in the valuation of a company. GuruFocus research has found that growth is closely correlated with the long term stock performance of a company. A faster-growing company creates more value for shareholders, especially if the growth is profitable. The 3-year average annual revenue growth of Grupo Simec SAB de CV is 16.8%, which ranks better than 69.76% of 582 companies in the Steel industry. The 3-year average EBITDA growth rate is 64.2%, which ranks better than 87.13% of 505 companies in the Steel industry.
ROIC vs WACC
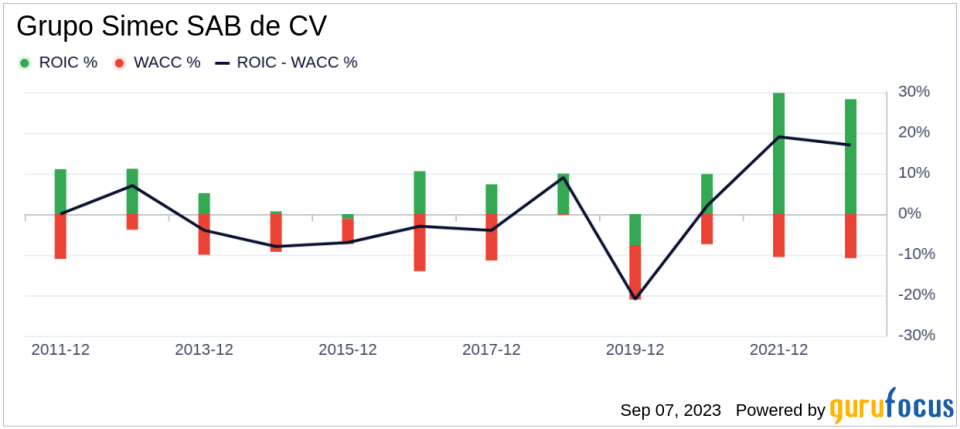
Another way to look at the profitability of a company is to compare its return on invested capital and the weighted cost of capital. Return on invested capital (ROIC) measures how well a company generates cash flow relative to the capital it has invested in its business. The weighted average cost of capital (WACC) is the rate that a company is expected to pay on average to all its security holders to finance its assets. We want to have the return on invested capital higher than the weighted cost of capital. For the past 12 months, Grupo Simec SAB de CV's return on invested capital is 14.54, and its cost of capital is 9.99. The historical ROIC vs WACC comparison of Grupo Simec SAB de CV is shown below:
Conclusion
In conclusion, the stock of Grupo Simec SAB de CV (SIM) appears to be modestly overvalued. The company's financial condition is strong and its profitability is strong. Its growth ranks better than 87.13% of 505 companies in the Steel industry. To learn more about Grupo Simec SAB de CV stock, you can check out its 30-Year Financials here.
To find out the high-quality companies that may deliver above-average returns, please check out GuruFocus High Quality Low Capex Screener.
This article first appeared on GuruFocus.
