Unveiling the Investment Potential of Brown & Brown Inc (BRO): A Deep Dive into Financial ...
Brown & Brown Inc (NYSE:BRO) has recently been in the spotlight, drawing interest from investors and financial analysts due to its robust financial stance. With shares currently priced at $70.94, Brown & Brown Inc has witnessed a daily loss of 0.98%, marked against a three-month change of 3.66%. A thorough analysis, underlined by the GF Score, suggests that Brown & Brown Inc is well-positioned for substantial growth in the near future.

Decoding the GF Score
The GF Score is a stock performance ranking system developed by GuruFocus using five aspects of valuation, which has been found to be closely correlated to the long-term performances of stocks by backtesting from 2006 to 2021. The stocks with a higher GF Score generally generate higher returns than those with a lower GF Score. Therefore, when picking stocks, investors should invest in companies with high GF Scores. The GF Score ranges from 0 to 100, with 100 as the highest rank.
Here is a breakdown of Brown & Brown Inc's GF Score:
Financial strength rank: 5/10
Profitability rank: 9/10
Growth rank: 10/10
GF Value rank: 5/10
Momentum rank: 9/10
Each one of these components is ranked and the ranks also have positive correlation with the long term performances of stocks. The GF score is calculated using the five key aspects of analysis. Through backtesting, we know that each of these key aspects has a different impact on the stock price performance. Thus, they are weighted differently when calculating the total score. With a high profitability rank and growth rank, and a moderate financial strength rank, GuruFocus assigned Brown & Brown Inc the GF Score of 93 out of 100, which signals the highest outperformance potential.
Understanding Brown & Brown Inc's Business
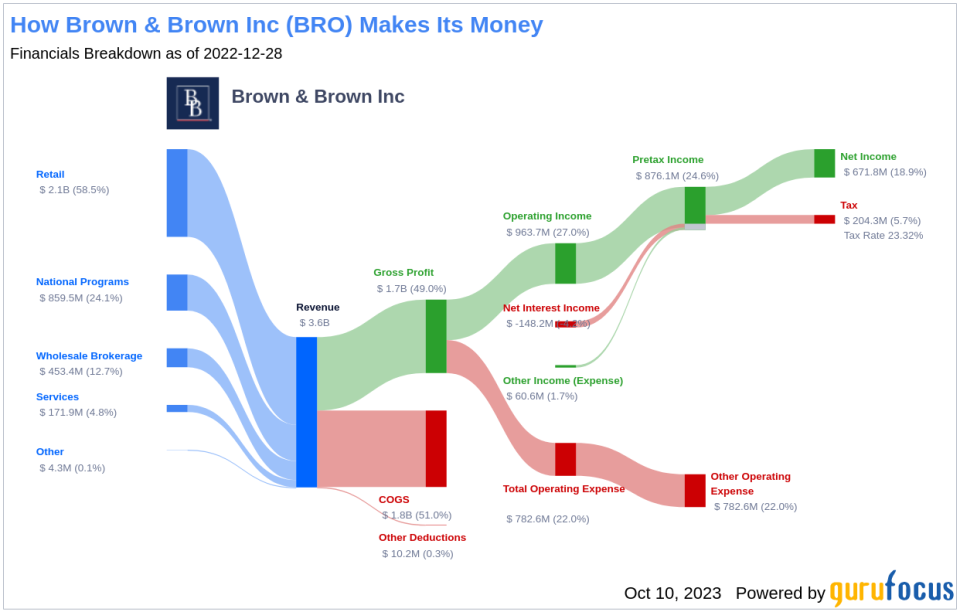
Brown & Brown Inc, with a market cap of $20.12 billion, is an insurance agent and broker that offers insurance products and services, primarily in the areas of property, casualty, and employee benefits. It connects customers with insurance companies, earning its revenue via commissions from insurance companies and direct fees from customers. It generally has no underwriting risk exposure. More than half of its revenue is from its retail segment, which provides a broad range of insurance products and services to entities and individuals. Roughly a fourth of revenue is from its national programs segment, which provides, among other things, professional liability coverage for professionals. The company operates primarily in the United States, with its highest exposure in Florida.
Profitability Rank Breakdown
The Profitability Rank shows Brown & Brown Inc's impressive standing among its peers in generating profit. Brown & Brown Inc's Operating Margin has increased (8.84%) over the past five years, as shown by the following data: 2018: 24.85; 2019: 23.93; 2020: 25.67; 2021: 28.05; 2022: 27.05. Furthermore, Brown & Brown Inc's Gross Margin has seen a consistent rise over the past five years, as evidenced by the data: 2018: 46.82; 2019: 45.14; 2020: 44.88; 2021: 46.29; 2022: 49.01. This trend underscores the company's growing proficiency in transforming revenue into profit.
Brown & Brown Inc's strong Predictability Rank of 4.5 stars out of five underscores its consistent operational performance, providing investors with increased confidence.
Growth Rank Breakdown
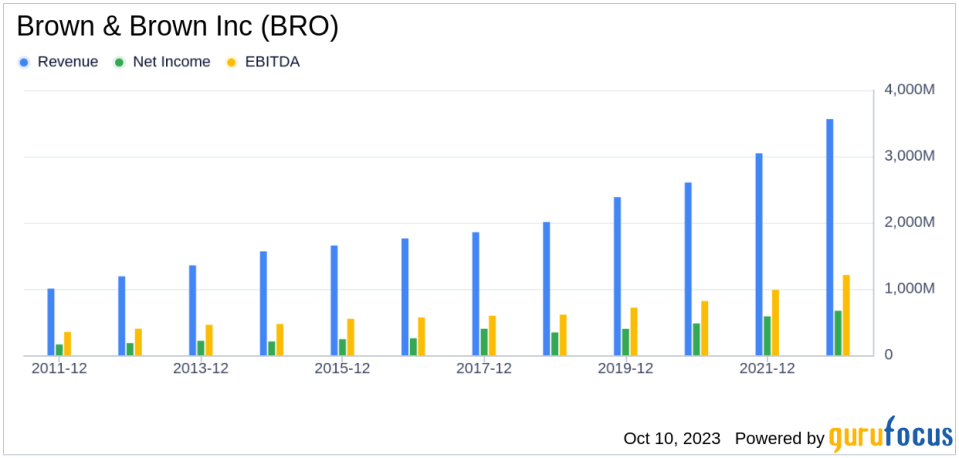
Ranked highly in Growth, Brown & Brown Inc demonstrates a strong commitment to expanding its business. The company's 3-Year Revenue Growth Rate is 13.8%, which outperforms better than 80.96% of 457 companies in the Insurance industry. Moreover, Brown & Brown Inc has seen a robust increase in its earnings before interest, taxes, depreciation, and amortization (EBITDA) over the past few years. Specifically, the three-year growth rate stands at 18.4, and the rate over the past five years is 15.6. This trend accentuates the company's continued capability to drive growth.
Conclusion
Given Brown & Brown Inc's strong financial strength, profitability, and growth metrics, the GF Score highlights the firm's unparalleled position for potential outperformance. This analysis underscores the company's robust financial health and growth prospects, making it a compelling investment opportunity for value investors.
GuruFocus Premium members can find more companies with strong GF Scores using the following screener link: GF Score Screen
This article, generated by GuruFocus, is designed to provide general insights and is not tailored financial advice. Our commentary is rooted in historical data and analyst projections, utilizing an impartial methodology, and is not intended to serve as specific investment guidance. It does not formulate a recommendation to purchase or divest any stock and does not consider individual investment objectives or financial circumstances. Our objective is to deliver long-term, fundamental data-driven analysis. Be aware that our analysis might not incorporate the most recent, price-sensitive company announcements or qualitative information. GuruFocus holds no position in the stocks mentioned herein.
This article first appeared on GuruFocus.
