Unveiling the Investment Potential of CoStar Group Inc (CSGP): A Comprehensive Analysis of ...
CoStar Group Inc (NASDAQ:CSGP) has recently been in the spotlight, drawing interest from investors and financial analysts due to its robust financial stance. With shares currently priced at 80.85, CoStar Group Inc has witnessed a daily gain of 0.26%, marked against a three-month change of -6.89%. A thorough analysis, underlined by the GF Score, suggests that CoStar Group Inc is well-positioned for substantial growth in the near future.
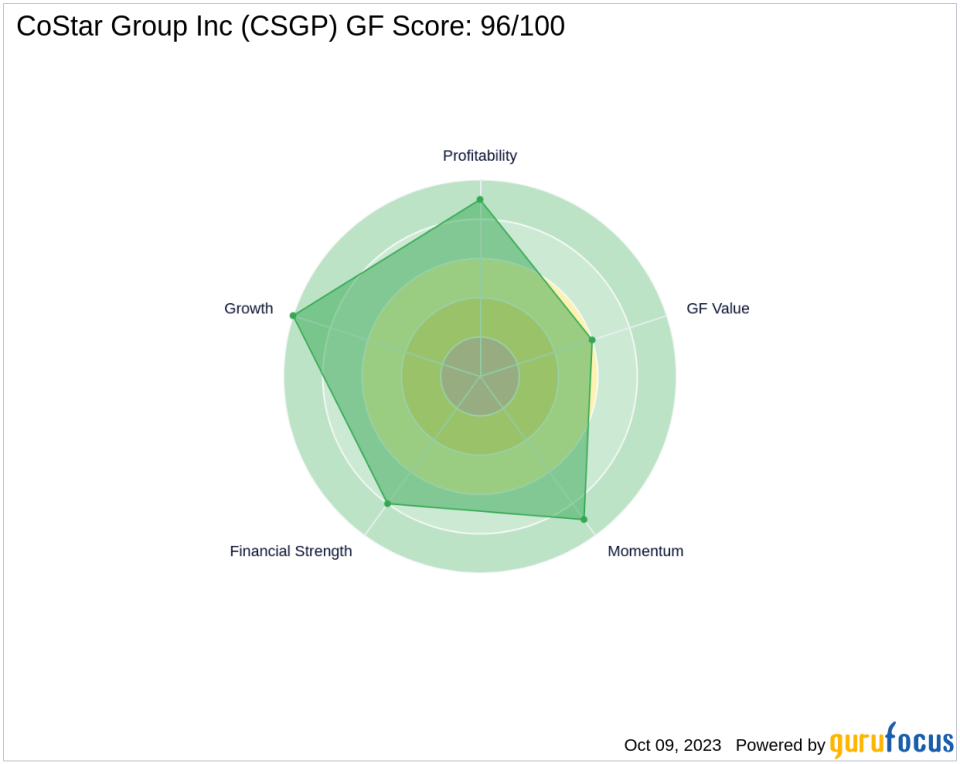
Decoding the GF Score
The GF Score is a stock performance ranking system developed by GuruFocus using five aspects of valuation, which has been found to be closely correlated to the long-term performances of stocks by backtesting from 2006 to 2021. The stocks with a higher GF Score generally generate higher returns than those with a lower GF Score. Therefore, when picking stocks, investors should invest in companies with high GF Scores. The GF Score ranges from 0 to 100, with 100 as the highest rank.
CoStar Group Inc's GF Score components are as follows:
Financial strength rank: 8/10
Profitability rank: 9/10
Growth rank: 10/10
GF Value rank: 6/10
Momentum rank: 9/10
Each one of these components is ranked and the ranks also have positive correlation with the long term performances of stocks. The GF score is calculated using the five key aspects of analysis. Through backtesting, we know that each of these key aspects has a different impact on the stock price performance. Thus, they are weighted differently when calculating the total score. With high ranks in financial strength, profitability, and growth, and decent ranks in GF value and momentum, GuruFocus assigned CoStar Group Inc the GF Score of 96 out of 100, which signals the highest outperformance potential.
Understanding CoStar Group Inc's Business
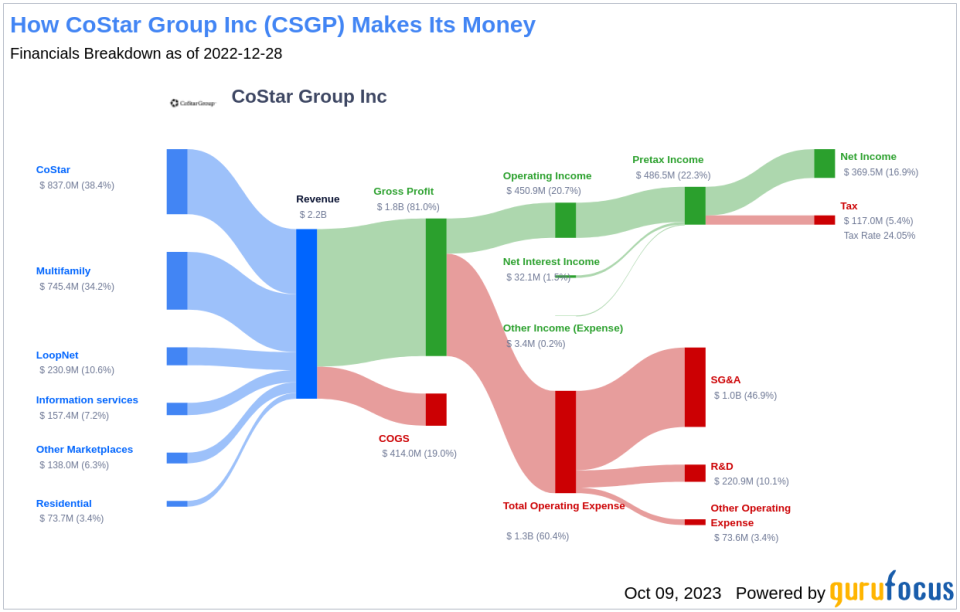
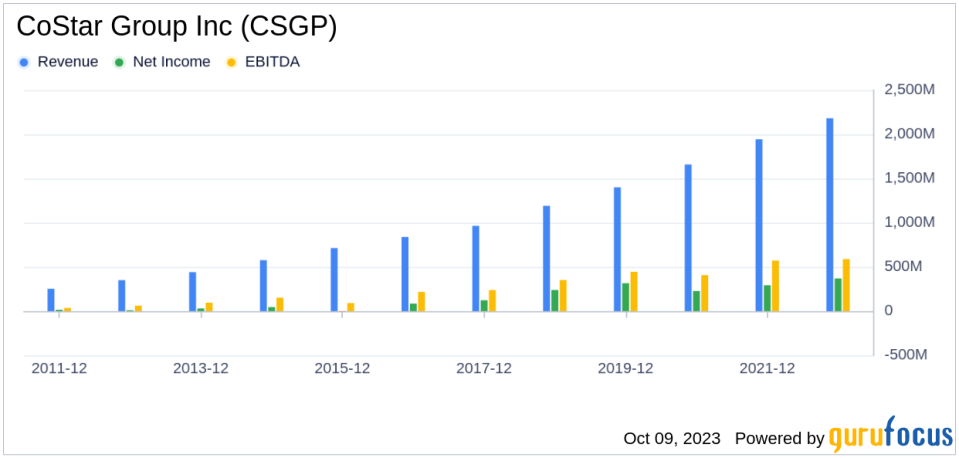
CoStar Group Inc, with a market cap of $33.01 billion and sales of $2.32 billion, is a leading provider of commercial real estate data and marketplace listing platforms. Its data offering contains in-depth analytical information on over 5 million commercial real estate properties related to various subsectors including office, retail, multifamily, healthcare, industrial, self-storage, and data centers. It operates many flagship brands such as CoStar Suite, LoopNet, Apartments.com, BizBuySell, and LandsofAmerica, with more than 80% of its revenue classified as subscription-based. The company also recently expanded its presence in Canada, the United Kingdom, Spain, and France.
Financial Strength Breakdown
According to the Financial Strength rating, CoStar Group Inc's robust balance sheet exhibits resilience against financial volatility, reflecting prudent management of capital structure. With an Altman Z-Score of 13.72, CoStar Group Inc exhibits a strong defense against financial distress, highlighting its robust financial stability. With a favorable Debt-to-Revenue ratio of 0.48, CoStar Group Inc's strategic handling of debt solidifies its financial health.
Profitability Rank Breakdown
The Profitability Rank shows CoStar Group Inc's impressive standing among its peers in generating profit. Furthermore, CoStar Group Inc's Gross Margin has seen a consistent rise over the past five years, as evidenced by the data: 2018: 77.35; 2019: 79.34; 2020: 81.38; 2021: 81.62; 2022: 81.03; . This trend underscores the company's growing proficiency in transforming revenue into profit. The Piotroski F-Score confirms CoStar Group Inc's solid financial situation based on Joseph Piotroski's nine-point scale, which measures a company's profitability, funding and operating efficiency. CoStar Group Inc's strong Predictability Rank of 4.5 stars out of five underscores its consistent operational performance, providing investors with increased confidence.
Growth Rank Breakdown
Ranked highly in Growth, CoStar Group Inc demonstrates a strong commitment to expanding its business. The company's 3-Year Revenue Growth Rate is 12.8%, which outperforms better than 69.9% of 1671 companies in the Real Estate industry. Moreover, CoStar Group Inc has seen a robust increase in its earnings before interest, taxes, depreciation, and amortization (EBITDA) over the past few years. Specifically, the three-year growth rate stands at 6.8, and the rate over the past five years is 14.6. This trend accentuates the company's continued capability to drive growth.
Conclusion
Given CoStar Group Inc's strong financial strength, profitability, and growth metrics, the GF Score highlights the firm's unparalleled position for potential outperformance. This analysis underscores the company's robust financial health, consistent profitability, and impressive growth trajectory, making it a compelling investment opportunity. GuruFocus Premium members can find more companies with strong GF Scores using the following screener link: GF Score Screen
This article, generated by GuruFocus, is designed to provide general insights and is not tailored financial advice. Our commentary is rooted in historical data and analyst projections, utilizing an impartial methodology, and is not intended to serve as specific investment guidance. It does not formulate a recommendation to purchase or divest any stock and does not consider individual investment objectives or financial circumstances. Our objective is to deliver long-term, fundamental data-driven analysis. Be aware that our analysis might not incorporate the most recent, price-sensitive company announcements or qualitative information. GuruFocus holds no position in the stocks mentioned herein.
This article first appeared on GuruFocus.
