Unveiling the Investment Potential of Paychex Inc (PAYX): A Comprehensive Analysis of Financial ...
Paychex Inc (NASDAQ:PAYX) has recently been in the spotlight, drawing interest from investors and financial analysts due to its robust financial stance. With shares currently priced at $116.44, Paychex Inc has witnessed a daily gain of 3.3%, marked against a three-month change of 5.48%. A thorough analysis, underlined by the GF Score, suggests that Paychex Inc is well-positioned for substantial growth in the near future.
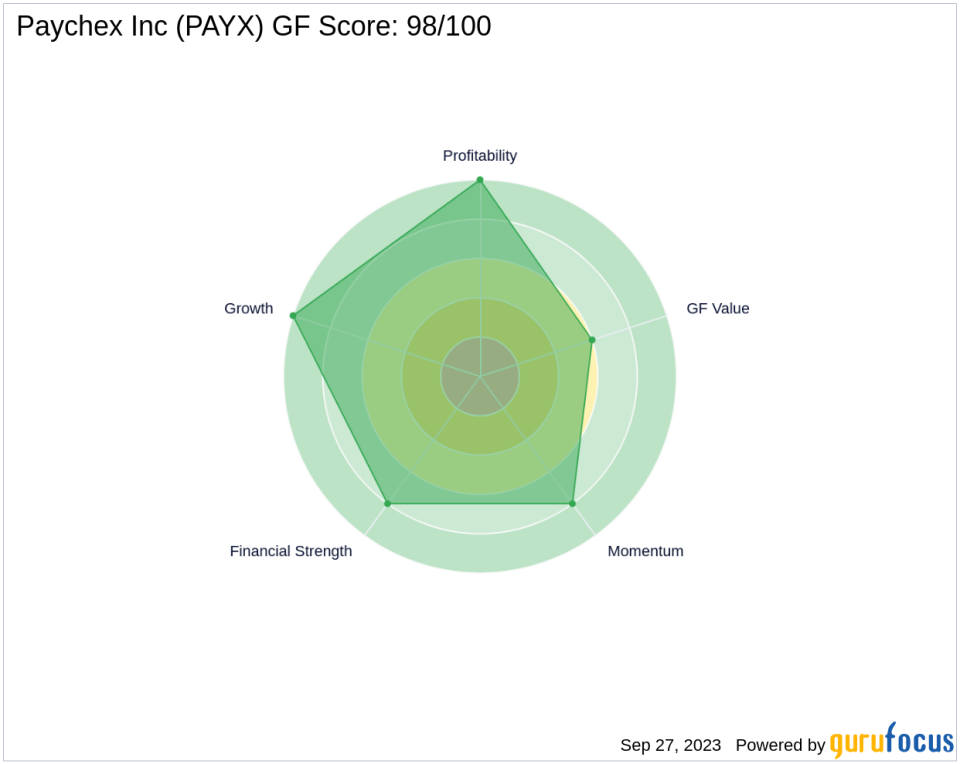
Decoding the GF Score
The GF Score is a stock performance ranking system developed by GuruFocus using five aspects of valuation, which has been found to be closely correlated to the long-term performances of stocks by backtesting from 2006 to 2021. The stocks with a higher GF Score generally generate higher returns than those with a lower GF Score. Therefore, when picking stocks, investors should invest in companies with high GF Scores. The GF Score ranges from 0 to 100, with 100 as the highest rank.
Paychex Inc's GF Score components are as follows:
Financial strength rank: 8/10
Profitability rank: 10/10
Growth rank: 10/10
GF Value rank: 6/10
Momentum rank: 8/10
Each one of these components is ranked and the ranks also have positive correlation with the long term performances of stocks. The GF score is calculated using the five key aspects of analysis. Through backtesting, we know that each of these key aspects has a different impact on the stock price performance. Thus, they are weighted differently when calculating the total score. With high ranks in financial strength, profitability, and growth, and decent ranks in GF value and momentum, GuruFocus assigned Paychex Inc the GF Score of 98 out of 100, which signals the highest outperformance potential.
Understanding Paychex Inc's Business
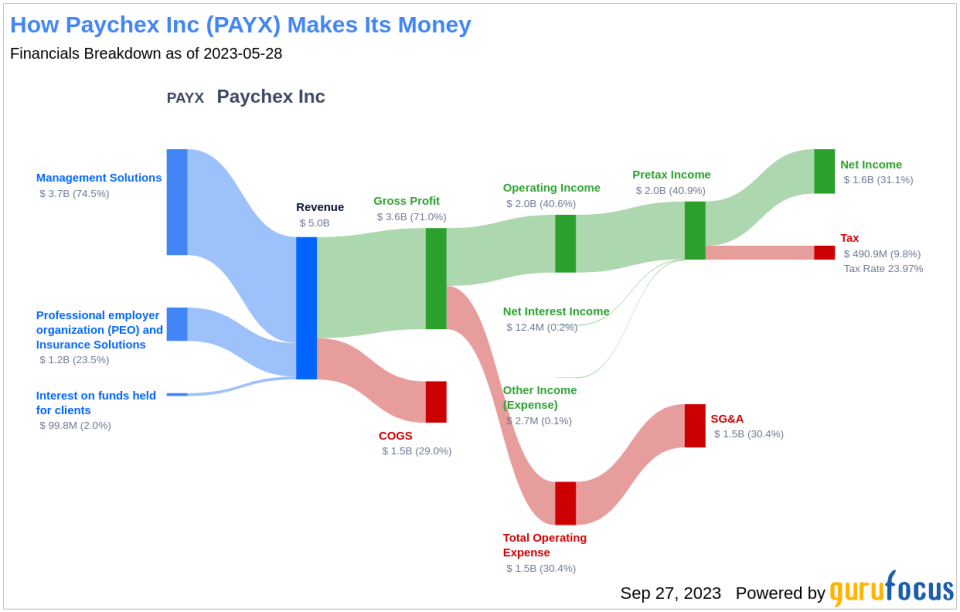
Established in 1979, Paychex Inc is a leading provider of payroll, human capital management, and insurance solutions servicing small and midsize clients primarily in the United States. The company services over 740,000 clients and pays over 1 in 12 U.S. private-sector workers. Alongside its traditional payroll services, Paychex offers HCM solutions such as benefits administration and time and attendance software, as well as human resources outsourcing and insurance agency services. With a market cap of $42.04 billion and sales of $5.01 billion, Paychex Inc operates with a margin of 40.6%.
Financial Strength Breakdown
According to the Financial Strength rating, Paychex Inc's robust balance sheet exhibits resilience against financial volatility, reflecting prudent management of capital structure.
The Interest Coverage ratio for Paychex Inc stands impressively at 55.4, underscoring its strong capability to cover its interest obligations. This robust financial position resonates with the wisdom of legendary investor Benjamin Graham, who favored companies with an interest coverage ratio of at least 5.
With an Altman Z-Score of 5.08, Paychex Inc exhibits a strong defense against financial distress, highlighting its robust financial stability.
With a favorable Debt-to-Revenue ratio of 0.17, Paychex Inc's strategic handling of debt solidifies its financial health.
Profitability Rank Breakdown
The Profitability Rank shows Paychex Inc's impressive standing among its peers in generating profit.
Paychex Inc Operating Margin has increased (6.19%) over the past five years, as shown by the following data: 2019: 36.35; 2020: 36.15; 2021: 36.01; 2022: 39.90; 2023: 40.60; .
Furthermore, Paychex Inc's Gross Margin has seen a consistent rise over the past five years, as evidenced by the data: 2019: 68.78; 2020: 68.30; 2021: 68.66; 2022: 70.59; 2023: 70.98; . This trend underscores the company's growing proficiency in transforming revenue into profit.
The Piotroski F-Score confirms Paychex Inc's solid financial situation based on Joseph Piotroski's nine-point scale, which measures a company's profitability, funding and operating efficiency.
Paychex Inc's strong Predictability Rank of 5.0 stars out of five underscores its consistent operational performance, providing investors with increased confidence.
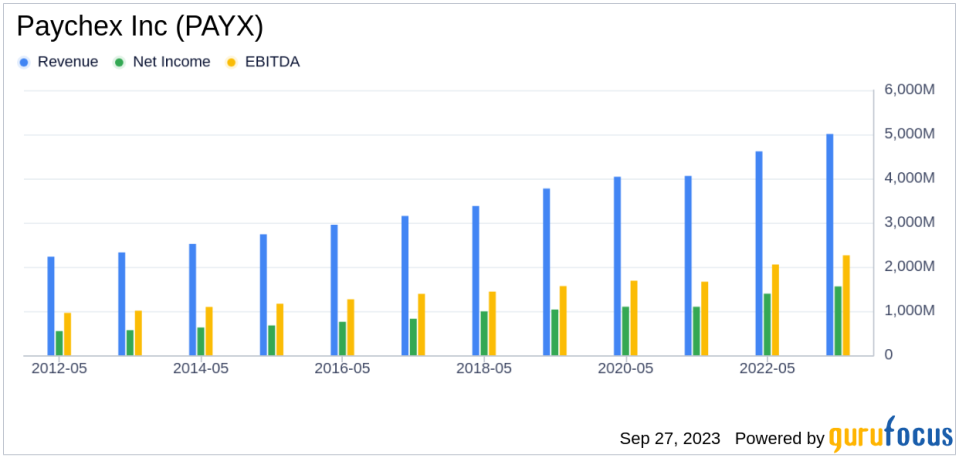
Growth Rank Breakdown
Ranked highly in Growth, Paychex Inc demonstrates a strong commitment to expanding its business.
The company's 3-Year Revenue Growth Rate is 7.3%, which outperforms better than 59.27% of 982 companies in the Business Services industry
Moreover, Paychex Inc has seen a robust increase in its earnings before interest, taxes, depreciation, and amortization (EBITDA) over the past few years. Specifically, the three-year growth rate stands at 10.2, and the rate over the past five years is 9. This trend accentuates the company's continued capability to drive growth.
Conclusion
Given Paychex Inc's strong financial strength, profitability, and growth metrics, the GF Score highlights the firm's unparalleled position for potential outperformance. This analysis underscores the importance of comprehensive financial evaluation in identifying investment opportunities with high return potential. As such, Paychex Inc (NASDAQ:PAYX) presents a compelling investment case for value investors seeking robust growth and profitability.
GuruFocus Premium members can find more companies with strong GF Scores using the following screener link: GF Score Screen
This article first appeared on GuruFocus.
