Unveiling the Investment Potential of Teradyne Inc (TER): A Comprehensive Analysis of Financial ...
Teradyne Inc (NASDAQ:TER) has recently been in the spotlight, drawing interest from investors and financial analysts due to its robust financial stance. With shares currently priced at $97.21, Teradyne Inc has witnessed a daily gain of 0.8%, marked against a three-month change of -8.53%. A thorough analysis, underlined by the GF Score, suggests that Teradyne Inc is well-positioned for substantial growth in the near future.
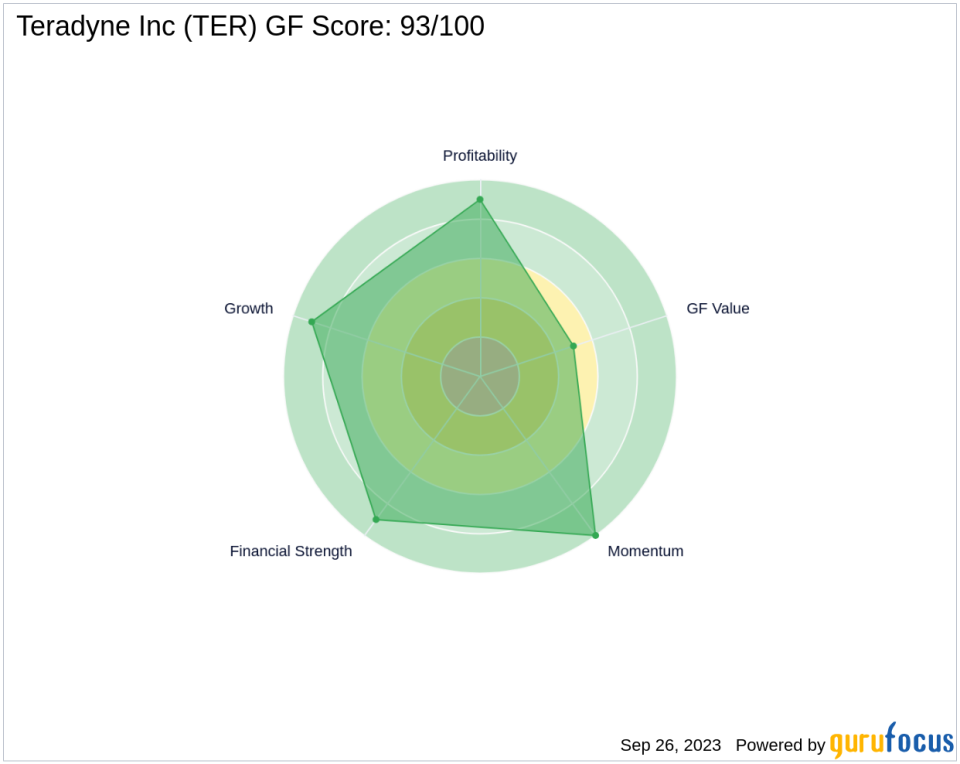
Decoding the GF Score
The GF Score is a stock performance ranking system developed by GuruFocus using five aspects of valuation, which has been found to be closely correlated to the long-term performances of stocks by backtesting from 2006 to 2021. The stocks with a higher GF Score generally generate higher returns than those with a lower GF Score. Therefore, when picking stocks, investors should invest in companies with high GF Scores. The GF Score ranges from 0 to 100, with 100 as the highest rank.
Teradyne Inc's GF Score components are as follows:
Financial strength rank: 9/10
Profitability rank: 9/10
Growth rank: 9/10
GF Value rank: 5/10
Momentum rank: 10/10
Each one of these components is ranked and the ranks also have positive correlation with the long term performances of stocks. The GF score is calculated using the five key aspects of analysis. Through backtesting, we know that each of these key aspects has a different impact on the stock price performance. Thus, they are weighted differently when calculating the total score. With high ranks in financial strength, profitability, and growth, and a slightly lower rank in GF Value, GuruFocus assigned Teradyne Inc the GF Score of 93 out of 100, which signals the highest outperformance potential.
Understanding Teradyne Inc's Business
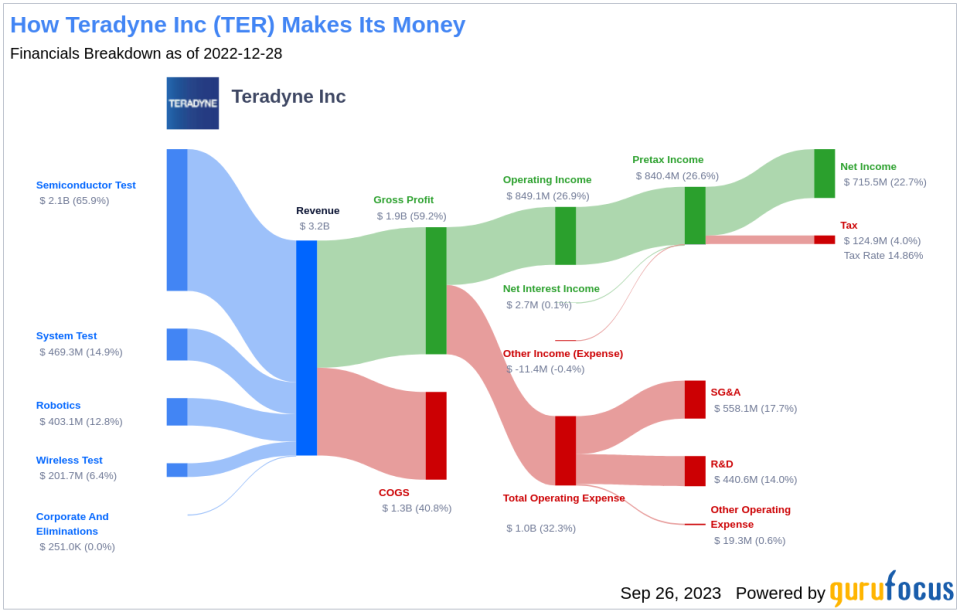
Teradyne Inc, with a market cap of $14.97 billion and sales of $2.86 billion, is a leading provider of testing equipment, including automated test equipment for semiconductors, system testing for hard disk drives, circuit boards, and electronics systems and wireless testing for devices. The firm entered the industrial automation market in 2015, into which it sells collaborative and autonomous robots for factory applications. Teradyne serves numerous end markets and geographies directly and indirectly with its products, but its most significant exposure is to semiconductor testing. Teradyne serves vertically integrated, fabless, and foundry chipmakers with its equipment. The company's operating margin stands at 22.32%.
Financial Strength Breakdown
According to the Financial Strength rating, Teradyne Inc's robust balance sheet exhibits resilience against financial volatility, reflecting prudent management of capital structure.
The Interest Coverage ratio for Teradyne Inc stands impressively at 166.93, underscoring its strong capability to cover its interest obligations. This robust financial position resonates with the wisdom of legendary investor Benjamin Graham, who favored companies with an interest coverage ratio of at least 5.
With an Altman Z-Score of 11.54, Teradyne Inc exhibits a strong defense against financial distress, highlighting its robust financial stability.
With a favorable Debt-to-Revenue ratio of 0.04, Teradyne Inc's strategic handling of debt solidifies its financial health.
Profitability Rank Breakdown
The Profitability Rank shows Teradyne Inc's impressive standing among its peers in generating profit.
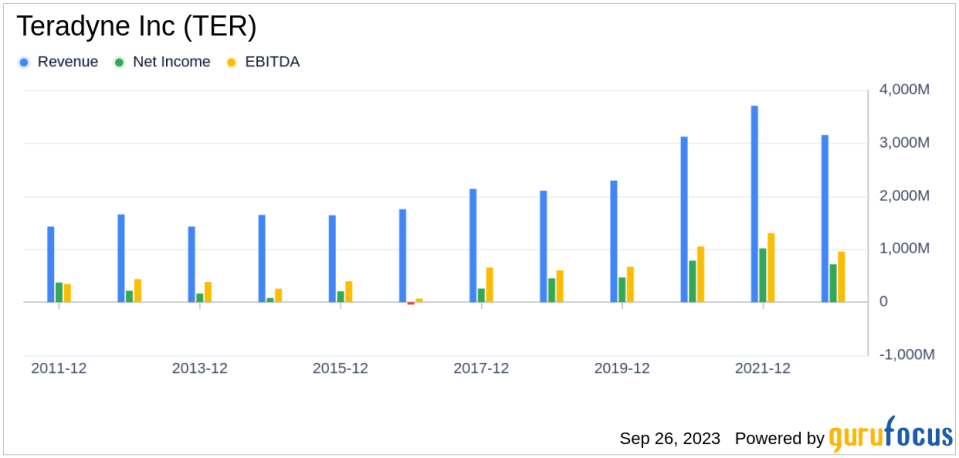
Teradyne Inc Operating Margin has increased (15.62%) over the past five years, as shown by the following data: 2018: 23.28; 2019: 23.52; 2020: 29.32; 2021: 32.68; 2022: 26.91; .
Furthermore, Teradyne Inc's Gross Margin has seen a consistent rise over the past five years, as evidenced by the data: 2018: 58.09; 2019: 58.38; 2020: 57.21; 2021: 59.59; 2022: 59.18; . This trend underscores the company's growing proficiency in transforming revenue into profit.
Growth Rank Breakdown
Ranked highly in Growth, Teradyne Inc demonstrates a strong commitment to expanding its business.
The company's 3-Year Revenue Growth Rate is 13.3%, which outperforms better than 53.33% of 872 companies in the Semiconductors industry
Moreover, Teradyne Inc has seen a robust increase in its earnings before interest, taxes, depreciation, and amortization (EBITDA) over the past few years. Specifically, the three-year growth rate stands at 14.7, and the rate over the past five years is 17.5. This trend accentuates the company's continued capability to drive growth.
Conclusion
Given Teradyne Inc's strong financial strength, profitability, and growth metrics, the GF Score highlights the firm's unparalleled position for potential outperformance. This analysis underscores the importance of comprehensive financial evaluation in identifying investment opportunities with high growth potential. Teradyne Inc's robust financial health, coupled with its strategic business operations, makes it a compelling investment prospect.
GuruFocus Premium members can find more companies with strong GF Scores using the following screener link: GF Score Screen
This article first appeared on GuruFocus.
