Unveiling JB Hunt Transport Services (JBHT)'s Value: Is It Really Priced Right? A Comprehensive ...
JB Hunt Transport Services Inc (NASDAQ:JBHT) experienced a daily gain of 3.19% and a 3-month gain of 4.21%. The company's Earnings Per Share (EPS) (EPS) stands at 8.19. But the question remains - is the stock fairly valued? In this analysis, we will dive into the financials of JB Hunt Transport Services Inc (NASDAQ:JBHT) to answer this question. This comprehensive evaluation will provide valuable insights into the company's intrinsic value, enabling informed investment decisions.
Company Overview
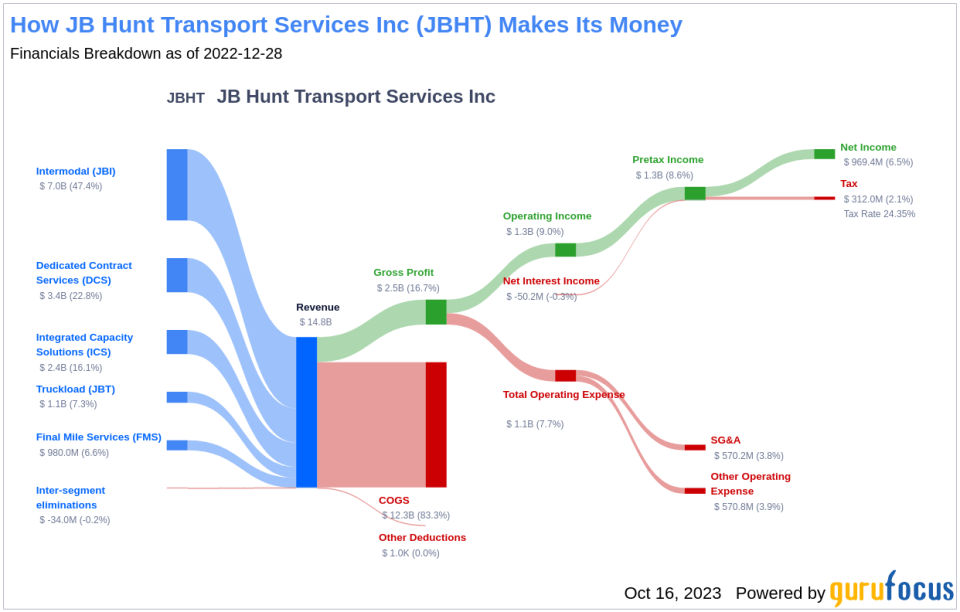
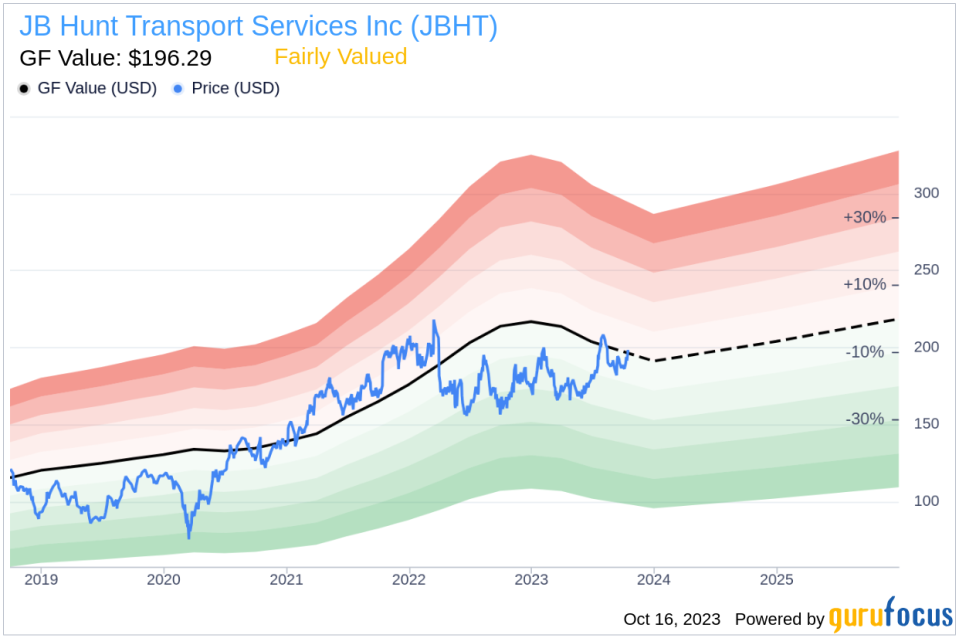
JB Hunt Transport Services ranks among the top surface transportation companies in North America by revenue. Its primary operating segments are intermodal delivery, dedicated trucking services, for-hire truckload, heavy goods final-mile delivery, and asset-light truck brokerage. The company's stock price currently stands at $197.51, whereas its estimated fair value (GF Value) is $196.29. This suggests that the stock is fairly valued.
Understanding GF Value
The GF Value is a proprietary measure that estimates the intrinsic value of a stock. It is computed based on historical trading multiples, a GuruFocus adjustment factor based on past performance and growth, and future business performance estimates. The GF Value Line on the summary page provides an overview of the fair value that the stock should be traded at. If the stock price is significantly above the GF Value Line, it is overvalued and its future return is likely to be poor. Conversely, if it is significantly below the GF Value Line, its future return will likely be higher.
According to GuruFocus Value calculation, the stock of JB Hunt Transport Services (NASDAQ:JBHT) appears to be fairly valued. At its current price of $197.51 per share and the market cap of $20.40 billion, JB Hunt Transport Services stock seems to be trading at its fair value. Because the stock is fairly valued, the long-term return of its stock is likely to be close to the rate of its business growth.
Link: These companies may deliver higher future returns at reduced risk.
Financial Strength
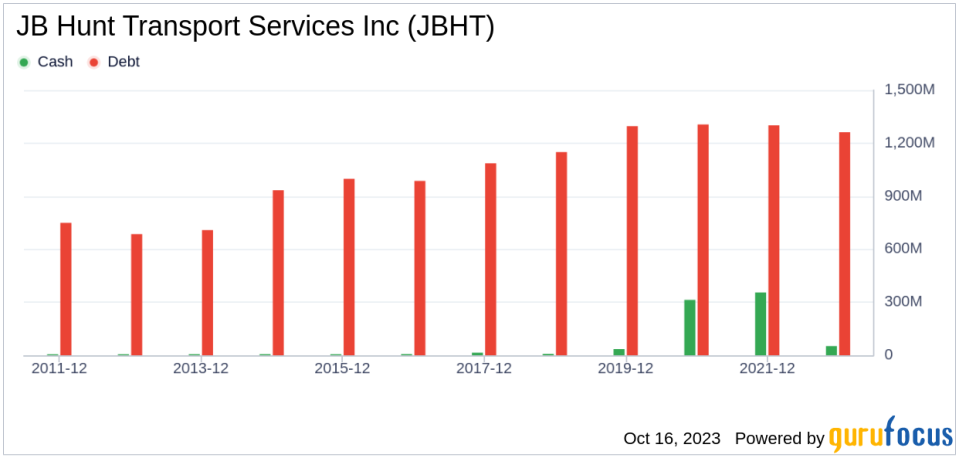
Investing in companies with low financial strength could result in permanent capital loss. Therefore, it's crucial to review a company's financial strength before deciding to buy shares. Looking at the cash-to-debt ratio and interest coverage can provide a good initial perspective on the company's financial strength. JB Hunt Transport Services has a cash-to-debt ratio of 0.21, which ranks worse than 70.55% of 944 companies in the Transportation industry. Based on this, GuruFocus ranks JB Hunt Transport Services's financial strength as 8 out of 10, suggesting a strong balance sheet.
Profitability and Growth
Investing in profitable companies, especially those that have demonstrated consistent profitability over the long term, poses less risk. A company with high profit margins is also typically a safer investment than one with low profit margins. JB Hunt Transport Services has been profitable 10 years over the past decade. Over the past twelve months, the company had a revenue of $13.90 billion and Earnings Per Share (EPS) of $8.19. Its operating margin is 8.61%, which ranks better than 50.94% of 954 companies in the Transportation industry. Overall, GuruFocus ranks the profitability of JB Hunt Transport Services at 9 out of 10, which indicates strong profitability.
One of the most important factors in the valuation of a company is growth. Long-term stock performance is closely correlated with growth according to GuruFocus research. Companies that grow faster create more value for shareholders, especially if that growth is profitable. The average annual revenue growth of JB Hunt Transport Services is 18.5%, which ranks better than 78.28% of 916 companies in the Transportation industry. The 3-year average EBITDA growth is 18.1%, which ranks better than 63.87% of 822 companies in the Transportation industry.
ROIC vs WACC
One can also evaluate a company's profitability by comparing its return on invested capital (ROIC) to its weighted average cost of capital (WACC). Return on invested capital (ROIC) measures how well a company generates cash flow relative to the capital it has invested in its business. The weighted average cost of capital (WACC) is the rate that a company is expected to pay on average to all its security holders to finance its assets. If the return on invested capital exceeds the weighted average cost of capital, the company is likely creating value for its shareholders. During the past 12 months, JB Hunt Transport Services's ROIC is 14.81 while its WACC came in at 11.96.

Conclusion
In summary, the stock of JB Hunt Transport Services (NASDAQ:JBHT) appears to be fairly valued. The company's financial condition is strong and its profitability is strong. Its growth ranks better than 63.87% of 822 companies in the Transportation industry. To learn more about JB Hunt Transport Services stock, you can check out its 30-Year Financials here.
To find out the high-quality companies that may deliver above-average returns, please check out GuruFocus High Quality Low Capex Screener.
This article, generated by GuruFocus, is designed to provide general insights and is not tailored financial advice. Our commentary is rooted in historical data and analyst projections, utilizing an impartial methodology, and is not intended to serve as specific investment guidance. It does not formulate a recommendation to purchase or divest any stock and does not consider individual investment objectives or financial circumstances. Our objective is to deliver long-term, fundamental data-driven analysis. Be aware that our analysis might not incorporate the most recent, price-sensitive company announcements or qualitative information. GuruFocus holds no position in the stocks mentioned herein.
This article first appeared on GuruFocus.
