Unveiling Liberty Latin America (LILA)'s Value: Is It Really Priced Right? A Comprehensive Guide
Liberty Latin America Ltd (NASDAQ:LILA) experienced a daily loss of -5.57%, and a 3-month loss of -0.93%. Despite these losses, the company has reported Earnings Per Share (EPS) of 0.91. The question that arises is whether the stock is modestly undervalued. This article aims to answer this question through a detailed valuation analysis of Liberty Latin America. We encourage you to read on for a comprehensive understanding of the company's value.
Company Introduction
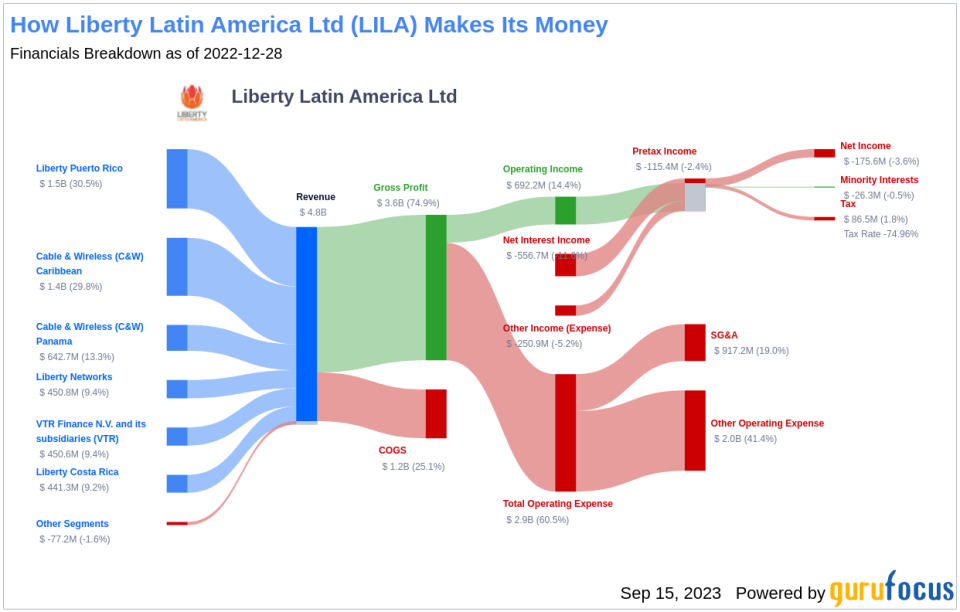
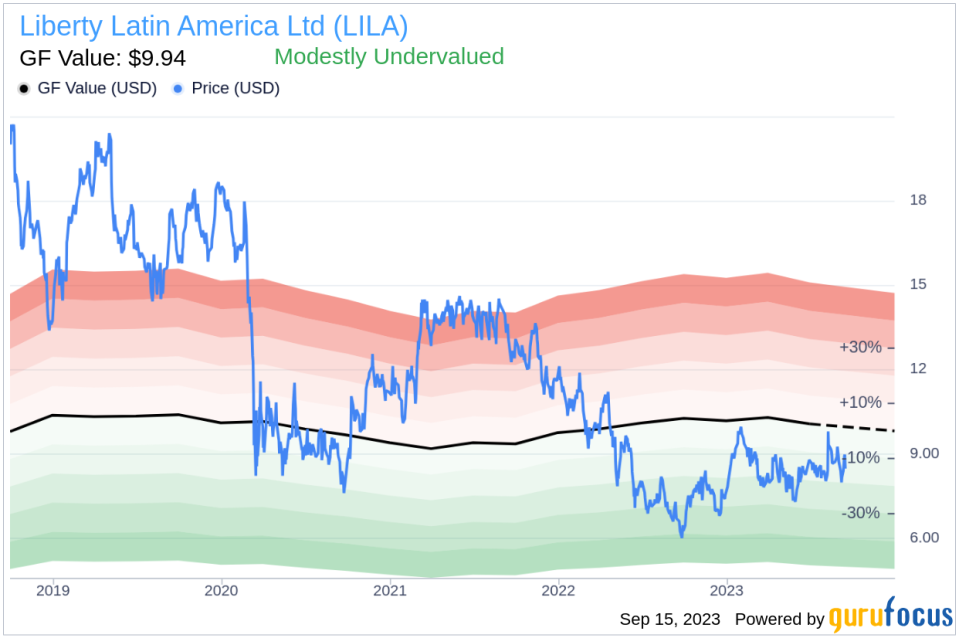
Liberty Latin America Ltd is a telecommunications company providing video, broadband internet, fixed-line telephony, and mobile services to residential and business customers. With reportable segments in the Caribbean, Panama, Puerto Rico, and Costa Rica, the company has a significant presence in the telecommunications industry. The current stock price stands at $8.47, while the GF Value, an estimate of fair value, is at $9.94. This discrepancy paves the way for an in-depth exploration of the company's value.
Understanding the GF Value
The GF Value is a proprietary measure that represents the current intrinsic value of a stock. It is derived from historical trading multiples, a GuruFocus adjustment factor based on the company's past returns and growth, and future business performance estimates. The GF Value Line provides an overview of the fair value at which the stock should ideally be traded. If the stock price is significantly above the GF Value Line, it is overvalued and its future return is likely to be poor. Conversely, if the stock price is significantly below the GF Value Line, its future return will likely be higher.
Liberty Latin America (NASDAQ:LILA) stock appears to be modestly undervalued based on the GF Value calculation. With a market cap of $1.80 billion at its current price of $8.47 per share, the stock seems to be trading below its fair value. Thus, the long-term return of its stock is likely to be higher than its business growth.
Financial Strength
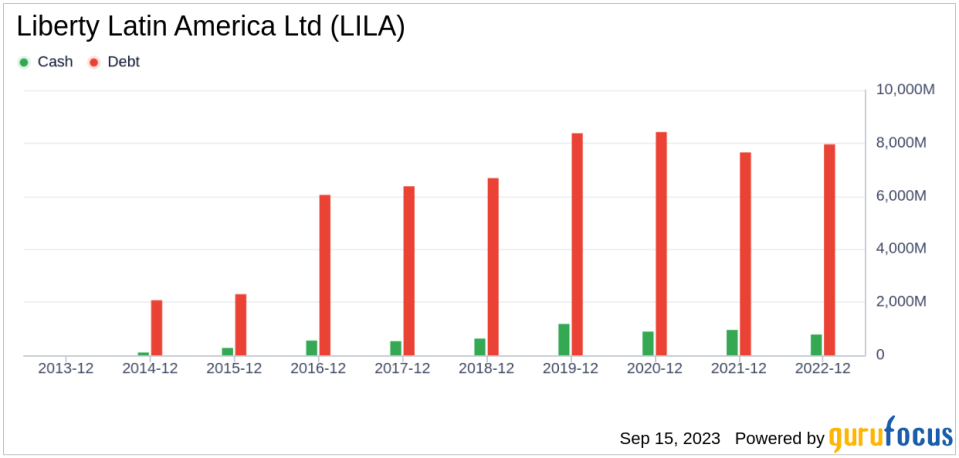
Examining the financial strength of a company before investing in its stock is crucial. Companies with poor financial strength pose a higher risk of permanent loss. The cash-to-debt ratio and interest coverage provide a good indication of a company's financial strength. Liberty Latin America's cash-to-debt ratio is 0.08, ranking it lower than 77.24% of 391 companies in the Telecommunication Services industry. This indicates that the financial strength of Liberty Latin America is poor.
Profitability and Growth
Companies that have been consistently profitable over the long term offer less risk for investors. Higher profit margins usually dictate a better investment compared to a company with lower profit margins. Liberty Latin America has been profitable 2 over the past 10 years. Over the past twelve months, the company had a revenue of $4.60 billion and Earnings Per Share (EPS) of $0.91. Its operating margin is 13.54%, which ranks better than 61.4% of 386 companies in the Telecommunication Services industry. Overall, the profitability of Liberty Latin America is ranked 5 out of 10, indicating fair profitability.
Growth is an essential factor in the valuation of a company. If a company's business is growing, it usually creates value for its shareholders, especially if the growth is profitable. Conversely, if a company's revenue and earnings are declining, the value of the company will decrease. Liberty Latin America's 3-year average revenue growth rate is worse than 60.69% of 379 companies in the Telecommunication Services industry. Its 3-year average EBITDA growth rate is 1.2%, ranking worse than 60.48% of 334 companies in the Telecommunication Services industry.
ROIC vs WACC
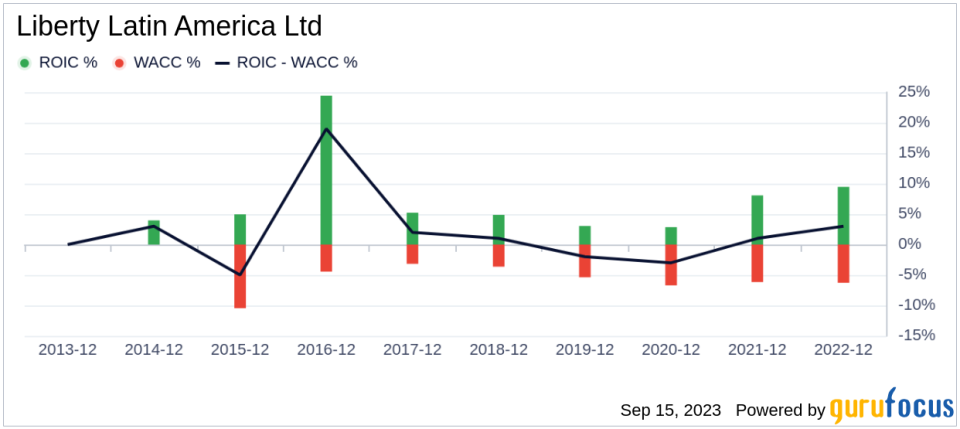
Comparing a company's return on invested capital (ROIC) to its weighted cost of capital (WACC) can also evaluate a company's profitability. Return on invested capital (ROIC) measures how well a company generates cash flow relative to the capital it has invested in its business. The weighted average cost of capital (WACC) is the rate that a company is expected to pay on average to all its security holders to finance its assets. If the ROIC is higher than the WACC, it indicates that the company is creating value for shareholders. Over the past 12 months, Liberty Latin America's ROIC was 3.6, while its WACC came in at 8.01.
Conclusion
In conclusion, the stock of Liberty Latin America (NASDAQ:LILA) appears to be modestly undervalued. The company's financial condition is poor, and its profitability is fair. Its growth ranks worse than 60.48% of 334 companies in the Telecommunication Services industry. To learn more about Liberty Latin America stock, you can check out its 30-Year Financials here.
To find out the high quality companies that may deliver above-average returns, please check out GuruFocus High Quality Low Capex Screener.
This article first appeared on GuruFocus.
