Unveiling The Mosaic Co (MOS)'s Value: Is It Really Priced Right? A Comprehensive Guide
With a daily loss of -3.73%, a 3-month loss of -7.89%, and an Earnings Per Share (EPS) of 6.33, The Mosaic Co (NYSE:MOS) presents an interesting case for value investors. The central question to answer is whether the stock is significantly undervalued. In this article, we will conduct a thorough valuation analysis to answer this question. We encourage you to continue reading to gain valuable insights into the intrinsic value of The Mosaic Co (NYSE:MOS).
Company Introduction
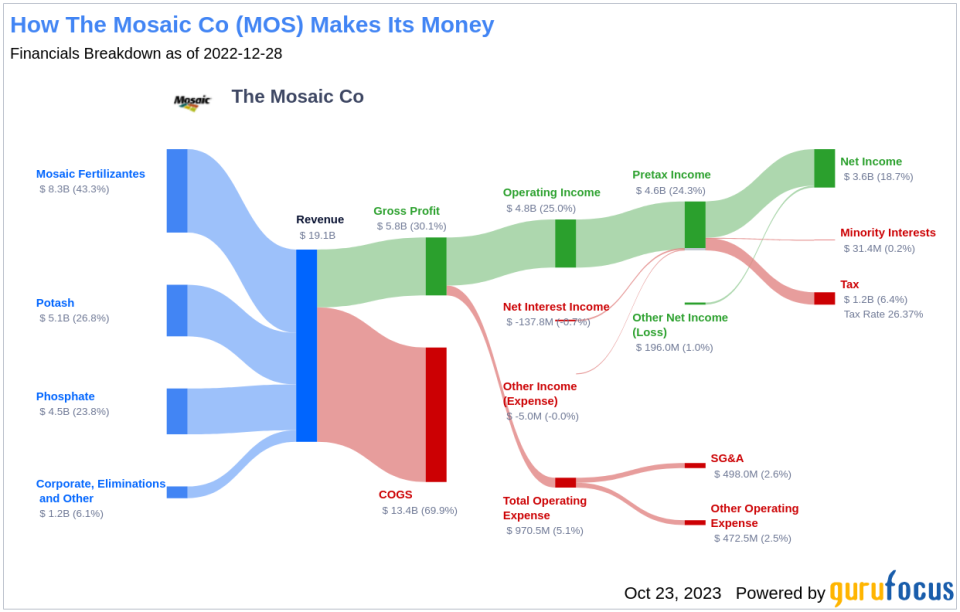
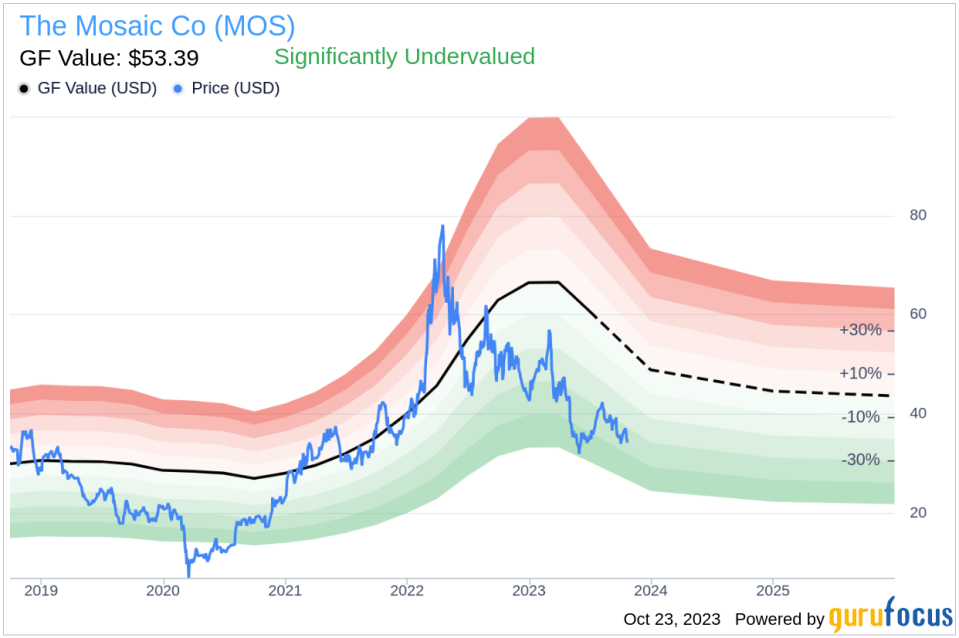
Formed in 2004 by the combination of IMC Global and Cargill's fertilizer business, The Mosaic Co (NYSE:MOS) has grown to become a leading producer of primary crop nutrients phosphate and potash. The company's assets include phosphate rock mines in Florida, Louisiana, Brazil, and Peru, and potash mines in Saskatchewan, New Mexico, and Brazil. With a current stock price of $34.09 and a GF Value of $53.39, The Mosaic Co (NYSE:MOS) appears to be significantly undervalued. The following analysis will delve deeper into the company's value, intertwining financial evaluation with essential company details.
Understanding the GF Value
The GF Value is a proprietary measure that represents the current intrinsic value of a stock. It is calculated based on historical trading multiples, a GuruFocus adjustment factor based on the company's past returns and growth, and future estimates of business performance. The GF Value Line provides an overview of the fair value at which the stock should ideally be traded. If the stock price is significantly above the GF Value Line, it is overvalued, and its future return is likely to be poor. Conversely, if it is significantly below the GF Value Line, its future return will likely be higher.
The Mosaic Co (NYSE:MOS) stock is estimated to be significantly undervalued based on the GuruFocus Value calculation. With a market cap of $11.30 billion at its current price of $34.09 per share, the stock's long-term return is likely to be much higher than its business growth due to its significant undervaluation.
Link: These companies may deliver higher future returns at reduced risk.
Financial Strength
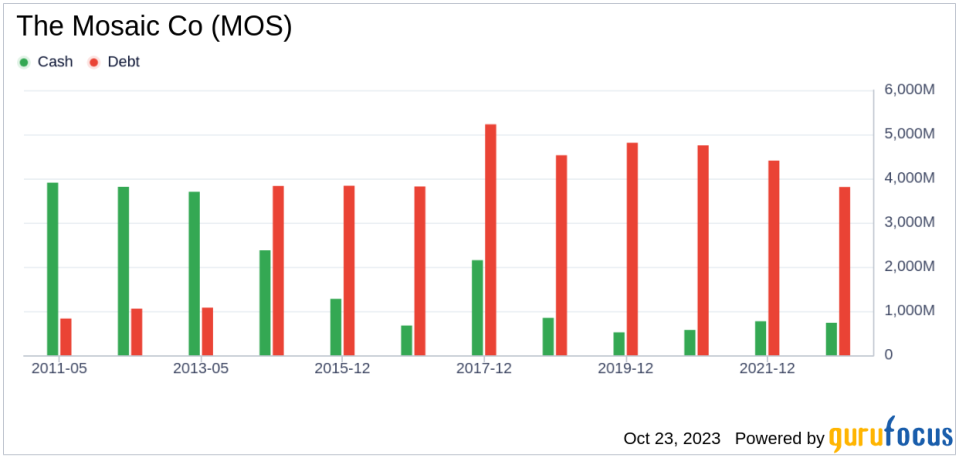
Investing in companies with low financial strength can result in permanent capital loss. Therefore, a careful review of a company's financial strength is crucial before deciding to buy shares. Looking at the cash-to-debt ratio and interest coverage can give a good initial perspective on the company's financial strength. The Mosaic Co has a cash-to-debt ratio of 0.16, which ranks worse than 76.42% of 246 companies in the Agriculture industry. Based on this, GuruFocus ranks The Mosaic Co's financial strength as 7 out of 10, suggesting a fair balance sheet.
Profitability and Growth
Investing in profitable companies, especially those that have demonstrated consistent profitability over the long term, poses less risk. A company with high profit margins is also typically a safer investment than one with low profit margins. The Mosaic Co has been profitable 8 over the past 10 years. Over the past twelve months, the company had a revenue of $16.80 billion and Earnings Per Share (EPS) of $6.33. Its operating margin is 16.46%, which ranks better than 79.75% of 242 companies in the Agriculture industry. Overall, GuruFocus ranks the profitability of The Mosaic Co at 8 out of 10, which indicates strong profitability.
Growth is probably one of the most important factors in the valuation of a company. GuruFocus' research has found that growth is closely correlated with the long-term performance of a company's stock. If a company's business is growing, the company usually creates value for its shareholders, especially if the growth is profitable. Likewise, if a company's revenue and earnings are declining, the value of the company will decrease. The Mosaic Co's 3-year average revenue growth rate is better than 81.58% of 228 companies in the Agriculture industry. The Mosaic Co's 3-year average EBITDA growth rate is 0%, which ranks worse than 0% of 220 companies in the Agriculture industry.
Another way to evaluate a company's profitability is to compare its return on invested capital (ROIC) to its weighted cost of capital (WACC). Return on invested capital (ROIC) measures how well a company generates cash flow relative to the capital it has invested in its business. The weighted average cost of capital (WACC) is the rate that a company is expected to pay on average to all its security holders to finance its assets. If the ROIC is higher than the WACC, it indicates that the company is creating value for shareholders. Over the past 12 months, The Mosaic Co's ROIC was 10.36, while its WACC came in at 9.58.

Conclusion
In conclusion, the stock of The Mosaic Co (NYSE:MOS) is estimated to be significantly undervalued. The company's financial condition is fair, and its profitability is strong. Its growth ranks worse than 0% of 220 companies in the Agriculture industry. To learn more about The Mosaic Co stock, you can check out its 30-Year Financials here.
To find out the high-quality companies that may deliver above-average returns, please check out GuruFocus High Quality Low Capex Screener.
This article, generated by GuruFocus, is designed to provide general insights and is not tailored financial advice. Our commentary is rooted in historical data and analyst projections, utilizing an impartial methodology, and is not intended to serve as specific investment guidance. It does not formulate a recommendation to purchase or divest any stock and does not consider individual investment objectives or financial circumstances. Our objective is to deliver long-term, fundamental data-driven analysis. Be aware that our analysis might not incorporate the most recent, price-sensitive company announcements or qualitative information. GuruFocus holds no position in the stocks mentioned herein.
This article first appeared on GuruFocus.
