Unveiling The Mosaic Co (MOS)'s Value: Is It Really Priced Right? A Comprehensive Guide
With a daily gain of 3.55%, a 3-month gain of 10.05%, and an Earnings Per Share (EPS) (EPS) of 6.33, The Mosaic Co (NYSE:MOS) is demonstrating promising performance. The question is, is the stock significantly undervalued? This article aims to provide a comprehensive valuation analysis of The Mosaic Co (NYSE:MOS) and encourages readers to delve into the detailed analysis that follows.
Company Introduction
Formed in 2004 by the combination of IMC Global and Cargill's fertilizer business, The Mosaic Co (NYSE:MOS) has become a leading producer of primary crop nutrients phosphate and potash. With assets including phosphate rock mines in Florida, Louisiana, Brazil, and Peru, as well as potash mines in Saskatchewan, New Mexico, and Brazil, The Mosaic Co (NYSE:MOS) has established a strong foothold in the agriculture industry. However, with a current stock price of $38.51, is it trading at a fair value? To answer this, we need to look at the GF Value, an estimation of the fair value of the stock.
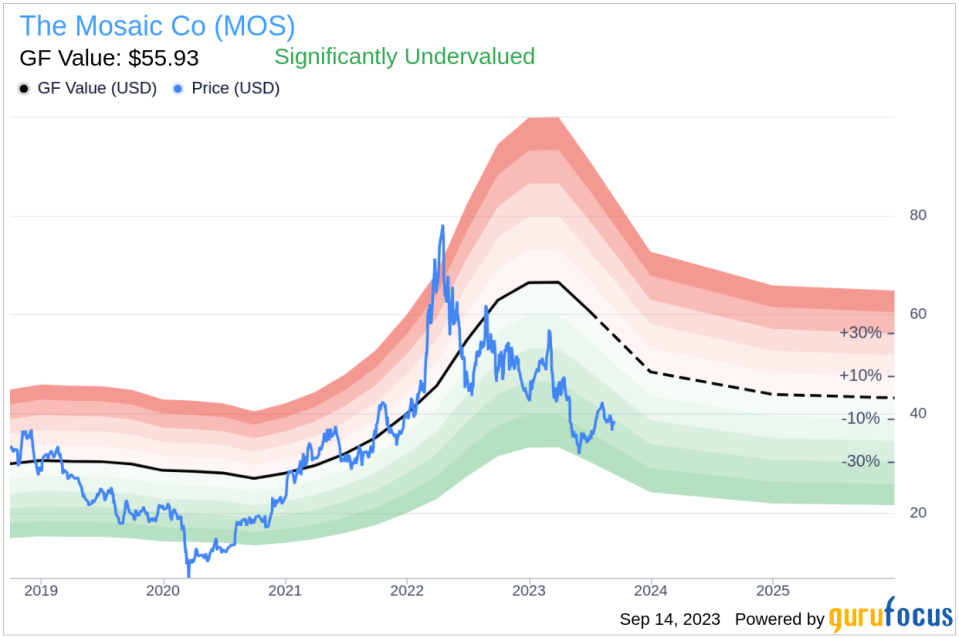
Understanding the GF Value
The GF Value is an intrinsic value of a stock derived from a unique method that takes into account historical multiples, a GuruFocus adjustment factor based on the company's past returns and growth, and future estimates of the business performance. The GF Value Line provides an overview of the fair value at which the stock should be traded.
According to the GuruFocus Value calculation, The Mosaic Co (NYSE:MOS) appears to be significantly undervalued. This is based on the historical multiples that the stock has traded at, the past business growth, and analyst estimates of future business performance. With its current price of $38.51 per share and a market cap of $12.80 billion, The Mosaic Co's stock seems to be significantly undervalued. As a result, the long-term return of its stock is likely to be much higher than its business growth.
Link: These companies may deliever higher future returns at reduced risk.
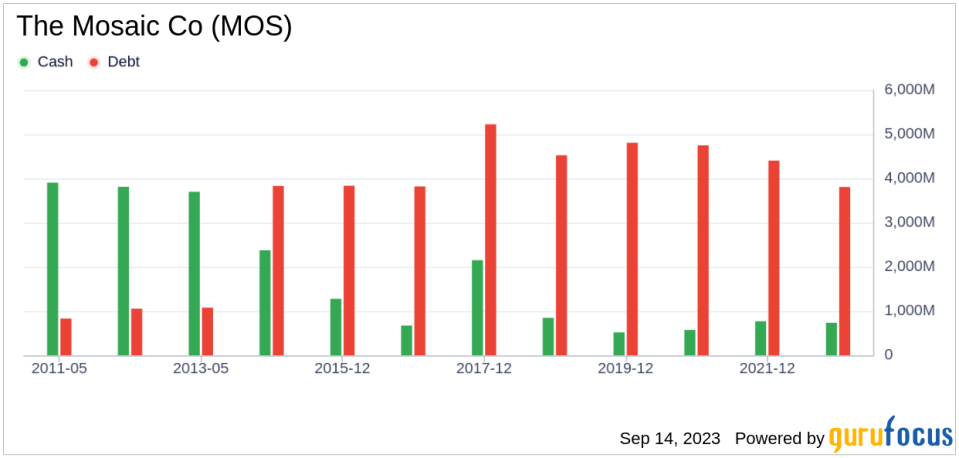
Financial Strength
It is always important to check the financial strength of a company before buying its stock. Investing in companies with poor financial strength have a higher risk of permanent loss. Looking at the cash-to-debt ratio and interest coverage is a great way to understand the financial strength of a company. The Mosaic Co has a cash-to-debt ratio of 0.16, which is worse than 77.18% of 241 companies in the Agriculture industry. The overall financial strength of The Mosaic Co is 6 out of 10, which indicates that the financial strength of The Mosaic Co is fair.
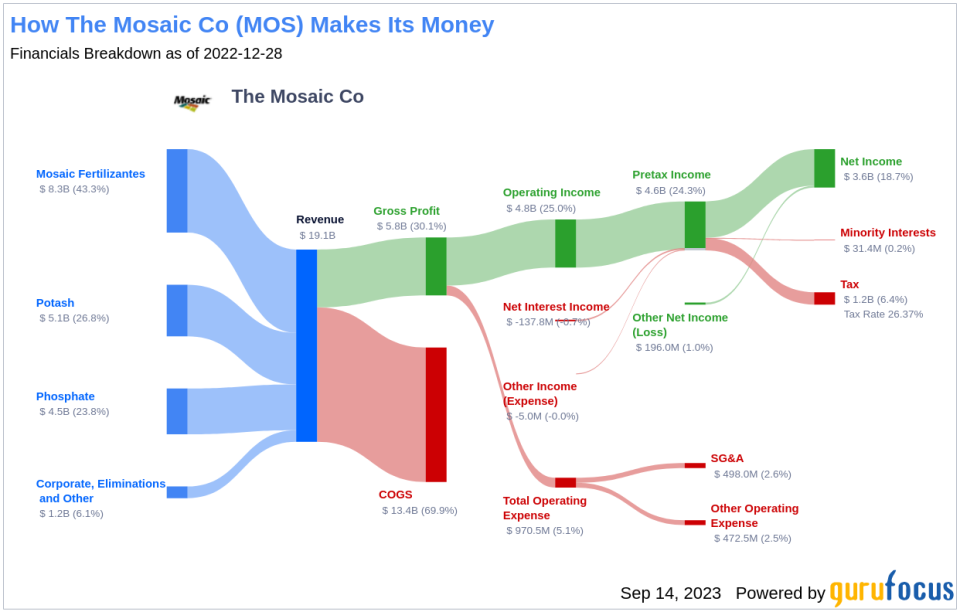
Profitability and Growth
Investing in profitable companies carries less risk, especially in companies that have demonstrated consistent profitability over the long term. Typically, a company with high profit margins offers better performance potential than a company with low profit margins. The Mosaic Co has been profitable 8 years over the past 10 years. During the past 12 months, the company had revenues of $16.80 billion and an Earnings Per Share (EPS) (EPS) of $6.33. Its operating margin of 16.46% is better than 78.21% of 234 companies in the Agriculture industry. Overall, GuruFocus ranks The Mosaic Co's profitability as strong.
Growth is probably one of the most important factors in the valuation of a company. GuruFocus' research has found that growth is closely correlated with the long-term performance of a company's stock. If a company's business is growing, the company usually creates value for its shareholders, especially if the growth is profitable. Likewise, if a company's revenue and earnings are declining, the value of the company will decrease. The Mosaic Co's 3-year average revenue growth rate is better than 81.7% of 224 companies in the Agriculture industry. The Mosaic Co's 3-year average EBITDA growth rate is 0%, which ranks worse than 0% of 214 companies in the Agriculture industry.
ROIC vs WACC
One can also evaluate a company's profitability by comparing its return on invested capital (ROIC) to its weighted average cost of capital (WACC). Return on invested capital (ROIC) measures how well a company generates cash flow relative to the capital it has invested in its business. The weighted average cost of capital (WACC) is the rate that a company is expected to pay on average to all its security holders to finance its assets. If the return on invested capital exceeds the weighted average cost of capital, the company is likely creating value for its shareholders. During the past 12 months, The Mosaic Co's ROIC is 10.36 while its WACC came in at 9.15.

Conclusion
In conclusion, the stock of The Mosaic Co (NYSE:MOS) shows every sign of being significantly undervalued. The company's financial condition is fair and its profitability is strong. Its growth ranks worse than 0% of 214 companies in the Agriculture industry. To learn more about The Mosaic Co stock, you can check out its 30-Year Financials here.
To find out the high quality companies that may deliver above average returns, please check out GuruFocus High Quality Low Capex Screener.
This article first appeared on GuruFocus.
