Unveiling Oceaneering International (OII)'s Value: Is It Really Priced Right? A Comprehensive Guide
Oceaneering International Inc (NYSE:OII) has recently experienced a daily gain of 4.13% and a three-month gain of 47.4%. Its Earnings Per Share (EPS) stands at 0.64. Despite these gains, the question arises: is the stock significantly overvalued? This article provides a comprehensive analysis of Oceaneering International's valuation and encourages readers to delve into the financial details of the company.
Company Introduction
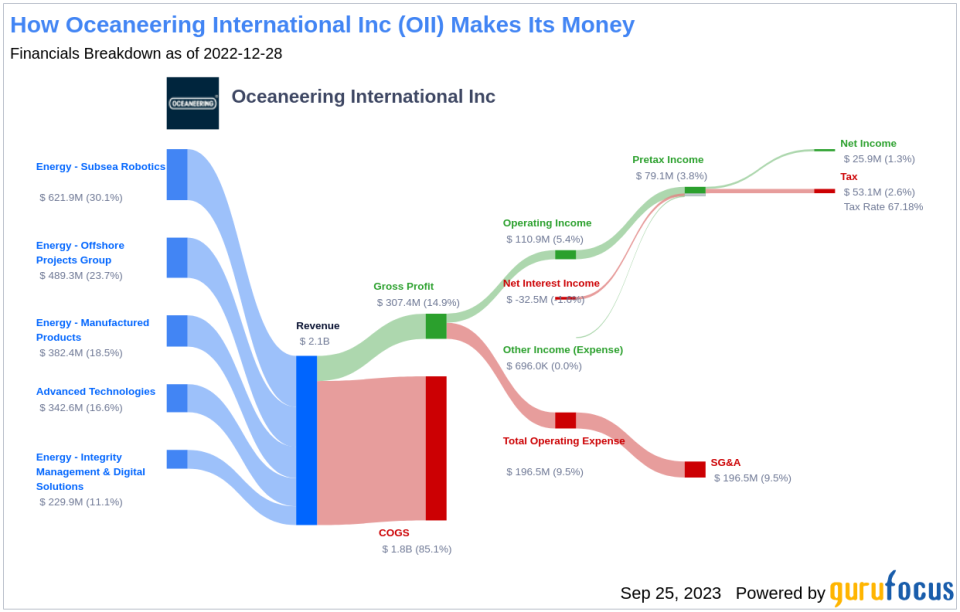
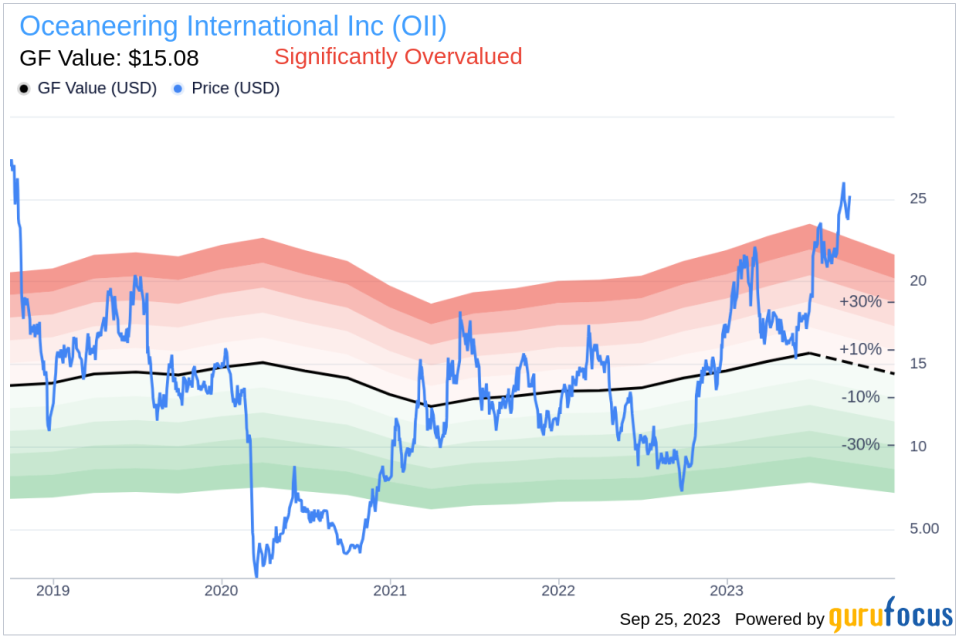
Oceaneering International is a global provider of engineered services and products, robotic solutions to offshore energy, defense, aerospace, manufacturing, and entertainment industries. It primarily caters to the offshore oil and gas market. The company's stock price currently stands at $25.22, with a market cap of $2.50 billion. However, according to the GF Value, an estimation of fair value, the stock should be priced at $15.08, suggesting that the stock may be significantly overvalued.
Understanding GF Value
The GF Value is a unique measure of a stock's intrinsic value, calculated based on historical trading multiples, an adjustment factor from GuruFocus based on past performance and growth, and future business performance estimates. The GF Value Line provides an overview of the fair value at which the stock should ideally be trading. If the stock price significantly surpasses the GF Value Line, the stock is likely overvalued, and its future returns may be poor. Conversely, if the stock price is significantly below the GF Value Line, the stock may be undervalued, and its future returns could be higher.
Based on GuruFocus' valuation method, Oceaneering International's stock is believed to be significantly overvalued. The stock's share price of $25.22 per share is significantly above the GF Value Line, indicating that the stock may be overvalued and may offer poor future returns. Therefore, the long-term return of Oceaneering International's stock is likely to be much lower than its future business growth.
Financial Strength
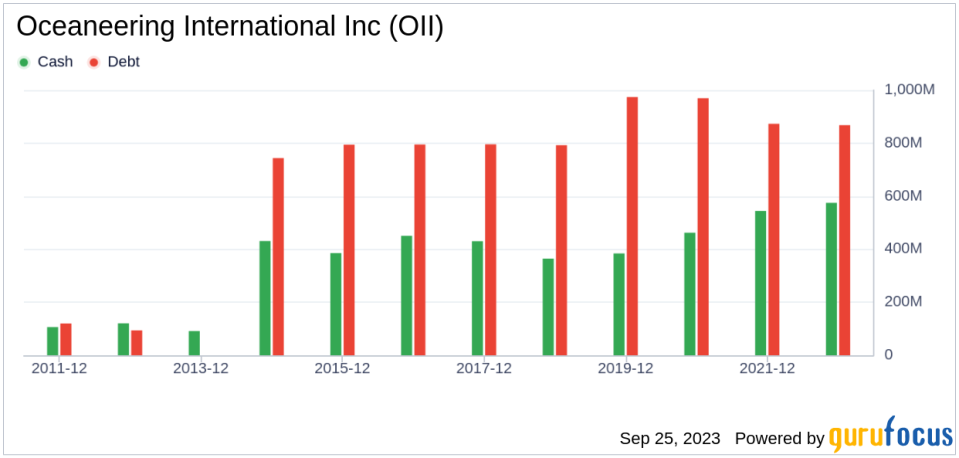
Assessing the financial strength of a company is crucial before investing in its stock. Companies with poor financial strength pose a higher risk of permanent loss. A look at the cash-to-debt ratio and interest coverage can provide a good understanding of a company's financial strength. Oceaneering International has a cash-to-debt ratio of 0.53, better than 50.19% of 1034 companies in the Oil & Gas industry. The overall financial strength of Oceaneering International is 6 out of 10, indicating fair financial strength.
Profitability and Growth
Investing in profitable companies, especially those that have demonstrated consistent profitability over the long term, poses less risk. Oceaneering International has been profitable 6 over the past 10 years. Over the past twelve months, the company had a revenue of $2.20 billion and Earnings Per Share (EPS) of $0.64. Its operating margin is 7.4%, ranking it lower than 52.85% of 984 companies in the Oil & Gas industry. Overall, GuruFocus ranks the profitability of Oceaneering International at 4 out of 10, indicating poor profitability.
Growth is a crucial factor in the valuation of a company. A faster-growing company creates more value for shareholders, especially if the growth is profitable. The 3-year average annual revenue growth of Oceaneering International is -0.6%, ranking it lower than 71% of 862 companies in the Oil & Gas industry. The 3-year average EBITDA growth rate is 0%, ranking it lower than 0% of 829 companies in the Oil & Gas industry.
ROIC vs WACC
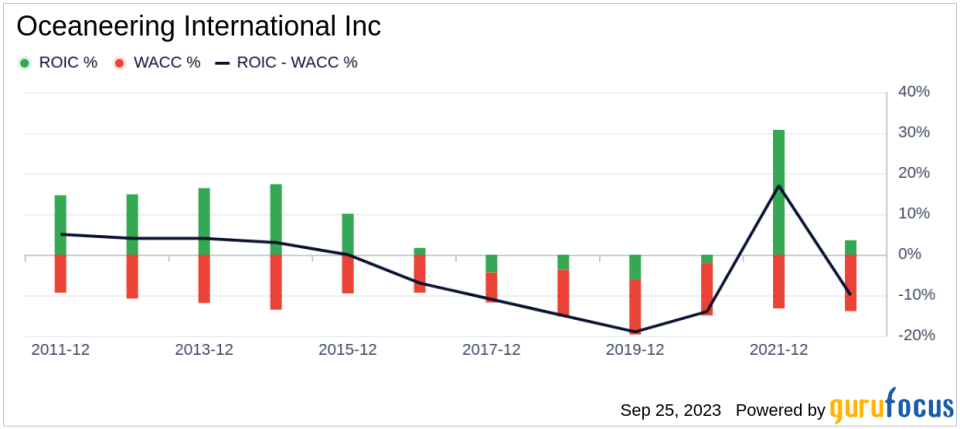
Another method of determining a company's profitability is to compare its return on invested capital (ROIC) to the weighted average cost of capital (WACC). The ROIC measures how well a company generates cash flow relative to the capital it has invested in its business. The WACC is the rate that a company is expected to pay on average to all its security holders to finance its assets. When the ROIC is higher than the WACC, it implies the company is creating value for shareholders. For the past 12 months, Oceaneering International's ROIC is 7.21, and its cost of capital is 13.4.
Conclusion
In summary, the stock of Oceaneering International is believed to be significantly overvalued. The company's financial condition is fair, but its profitability is poor. Its growth ranks lower than 0% of 829 companies in the Oil & Gas industry. To learn more about Oceaneering International stock, you can check out its 30-Year Financials here.
To find out the high-quality companies that may deliver above-average returns, please check out the GuruFocus High Quality Low Capex Screener.
This article first appeared on GuruFocus.
