Unveiling Omnicell (OMCL)'s Value: Is It Really Priced Right? A Comprehensive Guide
Omnicell Inc (NASDAQ:OMCL) has been a topic of interest in the financial market due to its recent 3.82% daily gain. Despite this positive change, the stock has experienced a 19.33% loss over the past three months. Additionally, it reported a Loss Per Share of 0.52. With these figures in mind, the question arises: Is Omnicell's stock significantly undervalued? This article aims to provide a comprehensive valuation analysis of Omnicell, shedding light on its intrinsic value and potential for future returns.
Company Overview
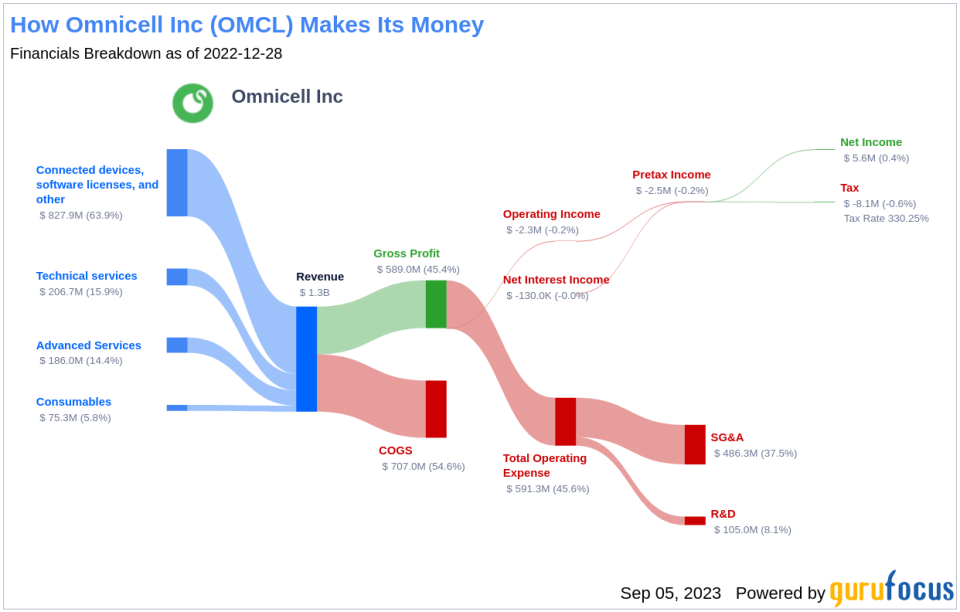
Omnicell Inc (NASDAQ:OMCL) is a renowned provider of automation and business analytics software for healthcare providers. The company's product portfolio comprises medication dispensing systems, pharmacy inventory management systems, and related software under its automation and analytics segment. Meanwhile, its medication adherence segment offers products like consumable medication blister cards and packaging equipment to facilitate medication administration outside of hospital settings. The majority of Omnicell's revenue is generated in the United States.
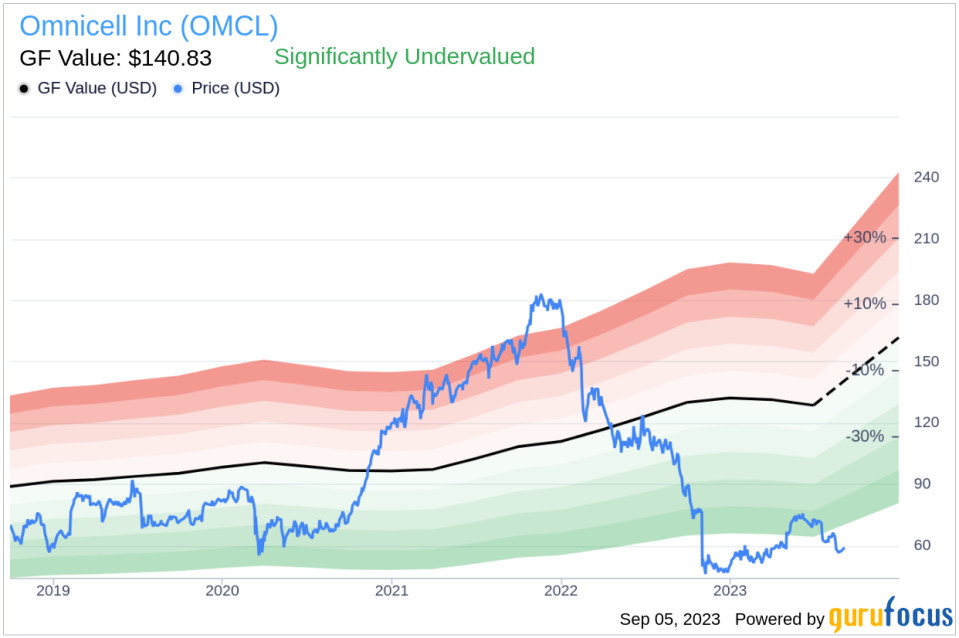
As of September 05, 2023, Omnicell's stock is priced at $59.22, with a market cap of $2.70 billion. However, according to GuruFocus's proprietary measure of a stock's intrinsic value, the GF Value, Omnicell's fair value stands at $140.83, suggesting that the stock might be significantly undervalued. The following analysis delves deeper into this valuation, providing a detailed overview of Omnicell's financial health, profitability, and growth.
Understanding GF Value
The GF Value is a unique measure that estimates a stock's intrinsic value based on historical trading multiples, a GuruFocus adjustment factor influenced by past performance and growth, and future business performance estimates. The GF Value Line, displayed on our summary page, provides an overview of the stock's ideal fair trading value.
If a stock's price significantly exceeds the GF Value Line, it is considered overvalued, and its future return is likely to be poor. Conversely, if the stock's price is significantly below the GF Value Line, it is undervalued, and its future return is expected to be higher. In the case of Omnicell, the stock appears to be significantly undervalued, indicating that the long-term return of its stock is likely to be much higher than its business growth.
Link: These companies may deliver higher future returns at reduced risk.
Financial Strength
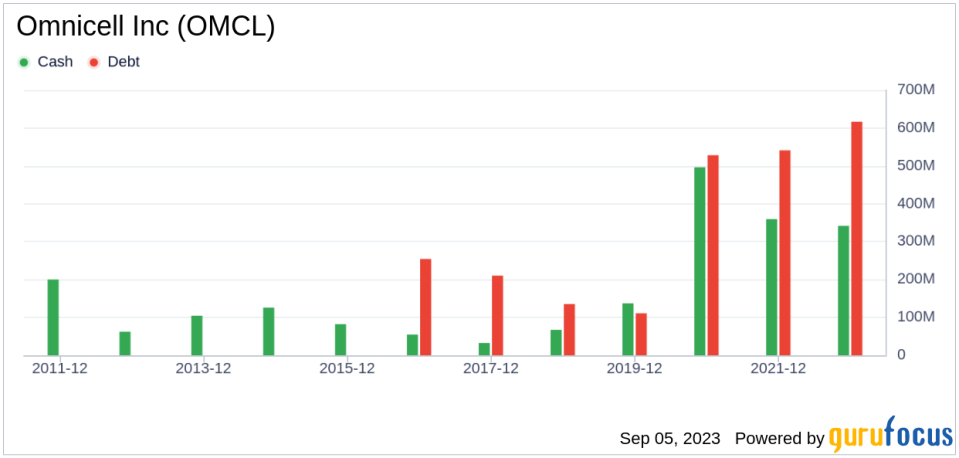
Before investing in a company's stock, it's crucial to assess its financial strength. Investing in companies with poor financial strength poses a higher risk of permanent loss. One effective way to evaluate a company's financial strength is by examining its cash-to-debt ratio and interest coverage. Omnicell has a cash-to-debt ratio of 0.67, which is lower than 50.92% of 654 companies in the Healthcare Providers & Services industry. With an overall financial strength score of 6 out of 10, Omnicell's financial health is considered fair.
Profitability and Growth
Investing in profitable companies generally carries less risk, especially when the company has demonstrated consistent profitability over a long period. A company with high profit margins often offers better performance potential than a company with low profit margins. Omnicell has been profitable for 10 out of the past 10 years. In the past 12 months, the company reported revenues of $1.20 billion and a Loss Per Share of $0.52. Its operating margin of -2.84% is lower than 65.22% of 647 companies in the Healthcare Providers & Services industry. Despite this, GuruFocus ranks Omnicell's profitability as strong.
Growth is a critical factor in a company's valuation. Research by GuruFocus has found that growth is closely correlated with the long-term stock performance of a company. A faster-growing company creates more value for shareholders, especially if the growth is profitable. Omnicell's 3-year average annual revenue growth is 10.6%, which ranks better than 54.82% of 571 companies in the Healthcare Providers & Services industry. However, its 3-year average EBITDA growth rate is -14%, ranking lower than 80.15% of 524 companies in the same industry.
ROIC vs WACC
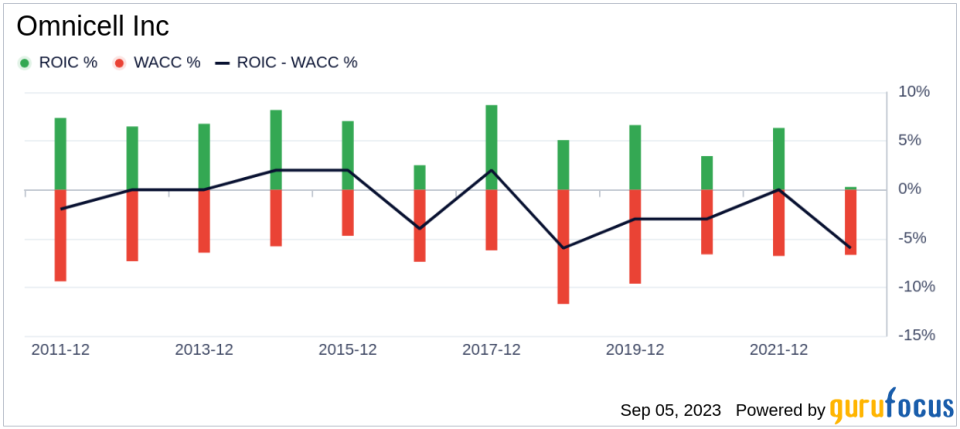
Another effective way to evaluate a company's profitability is by comparing its return on invested capital (ROIC) to its weighted average cost of capital (WACC). ROIC measures how well a company generates cash flow relative to the capital it has invested in its business. WACC is the rate that a company is expected to pay on average to all its security holders to finance its assets. If the ROIC is higher than the WACC, it indicates that the company is creating value for shareholders. Over the past 12 months, Omnicell's ROIC was -1.75, while its WACC came in at 7.11.
Conclusion
In summary, Omnicell's stock appears to be significantly undervalued. The company's financial condition is fair, and its profitability is strong. However, its growth ranks lower than 80.15% of 524 companies in the Healthcare Providers & Services industry. To learn more about Omnicell's stock, you can check out its 30-Year Financials here.
To find high-quality companies that may deliver above-average returns, check out the GuruFocus High Quality Low Capex Screener.
This article first appeared on GuruFocus.
