Unveiling Par Pacific Holdings (PARR)'s Value: Is It Really Priced Right?
Par Pacific Holdings Inc (NYSE:PARR) witnessed a gain of 2.27% in its daily stock price, with a 37.91% increase over the last three months. The company's Earnings Per Share (EPS) stand at 10.26. However, the question remains: Is the stock modestly overvalued? This article aims to provide an in-depth analysis of Par Pacific Holdings' valuation, encouraging readers to delve into the details that follow.
A Brief Introduction to Par Pacific Holdings
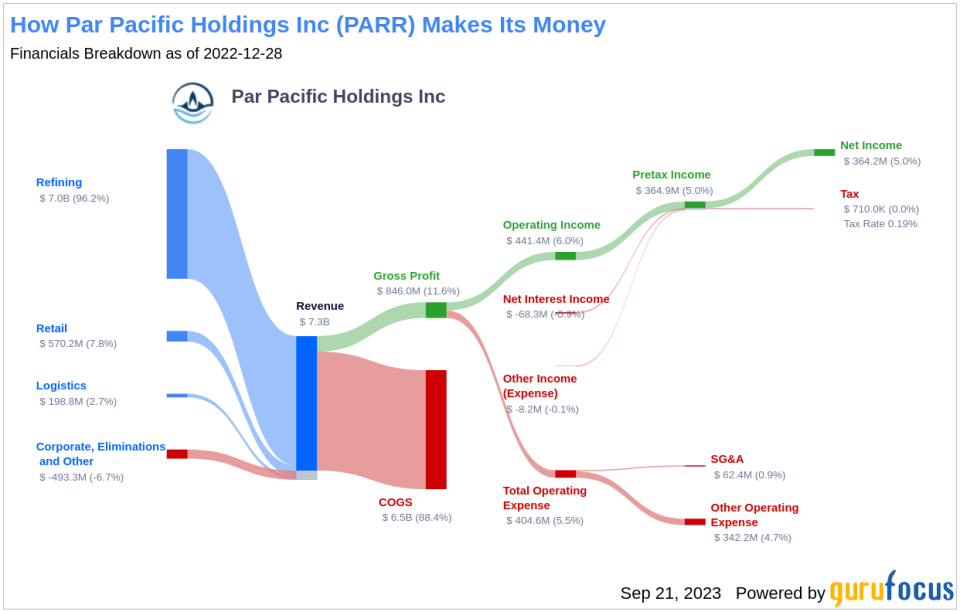
Par Pacific Holdings Inc is an oil and gas company that manages and maintains interests in energy and infrastructure businesses. The company operates through three reportable segments: Refining, Retail, and Logistics. The Refining segment, which generates maximum revenue, produces ultra-low-sulfur diesel, gasoline, jet fuel, marine fuel, LSFO, and other associated refined products. The Retail segment operates licenses out brands to serve the retail consumer, while the Logistics segment ensures the delivery of crude shipments to the refinery and exports finished products.
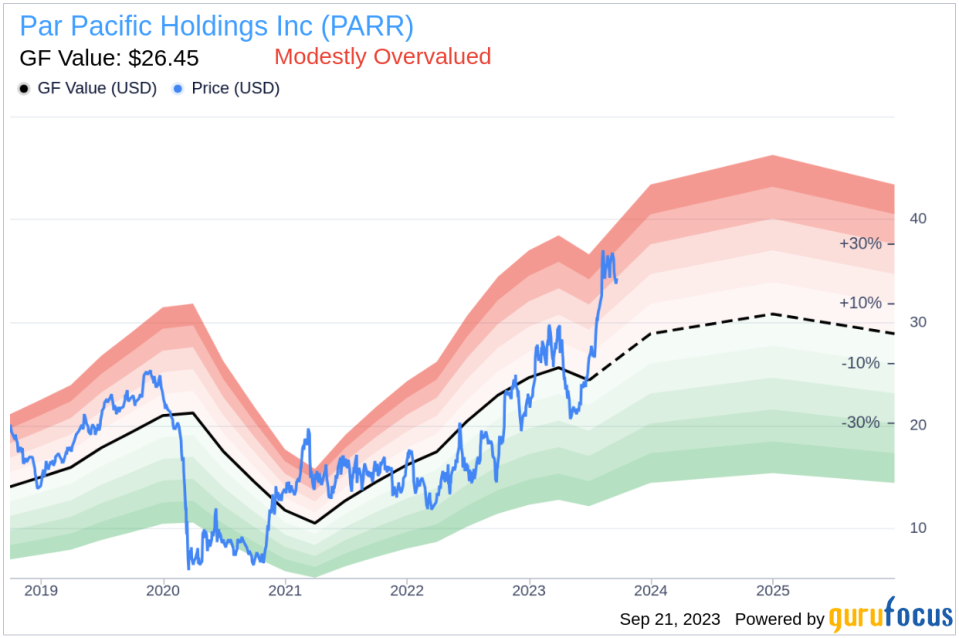
With a current stock price of $34.3 per share and a market cap of $2.10 billion, Par Pacific Holdings' valuation appears to be modestly overvalued when compared to its GF Value of $26.45. This comparison sets the stage for a deeper exploration into the company's intrinsic value.
Understanding GF Value
The GF Value is a proprietary measure that represents the current intrinsic value of a stock. It is calculated based on historical trading multiples, a GuruFocus adjustment factor based on past performance and growth, and future business performance estimates. The GF Value Line on our summary page provides an overview of the fair value at which the stock should ideally be traded.
According to the GF Value calculation, Par Pacific Holdings' stock appears to be modestly overvalued. If the price of a stock is significantly above the GF Value Line, it is considered overvalued, and its future return is likely to be poor. Conversely, if it is significantly below the GF Value Line, its future return will likely be higher.
Given that Par Pacific Holdings is relatively overvalued, the long-term return of its stock is likely to be lower than its business growth.
Link: These companies may deliver higher future returns at reduced risk.
Examining Par Pacific Holdings' Financial Strength
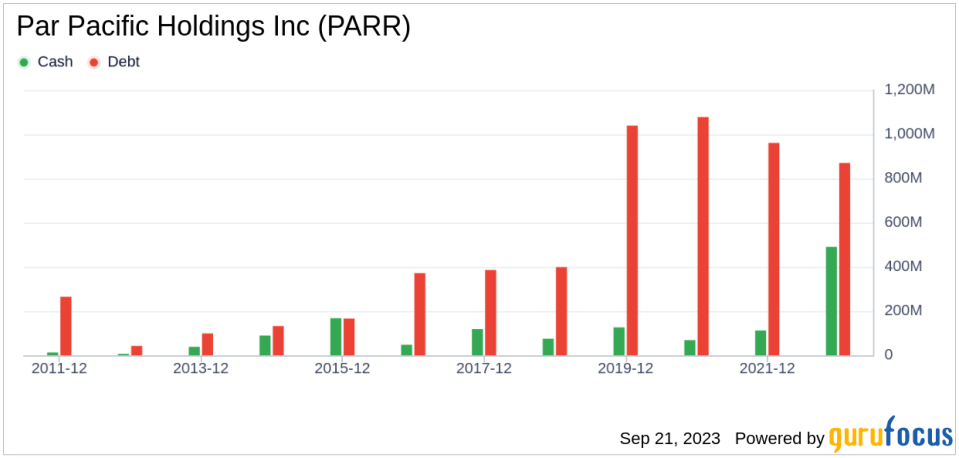
Companies with poor financial strength pose a high risk of permanent capital loss for investors. To avoid this, it's crucial to review a company's financial strength before purchasing shares. Key indicators of financial strength include the company's cash-to-debt ratio and interest coverage. Par Pacific Holdings has a cash-to-debt ratio of 0.21, ranking worse than 68.25% of 1033 companies in the Oil & Gas industry. The overall financial strength of Par Pacific Holdings is 6 out of 10, indicating fair financial strength.
Profitability and Growth of Par Pacific Holdings
Companies that have consistently been profitable over the long term offer less risk for investors. Par Pacific Holdings has been profitable 4 times over the past 10 years. Over the past twelve months, the company had a revenue of $7.30 billion and Earnings Per Share (EPS) of $10.26. Its operating margin is 9.66%, ranking better than 52.54% of 984 companies in the Oil & Gas industry. Overall, the profitability of Par Pacific Holdings is ranked 5 out of 10, indicating fair profitability.
Growth is a crucial factor in the valuation of a company. Par Pacific Holdings' 3-year average revenue growth rate is worse than 61.79% of 861 companies in the Oil & Gas industry. However, its 3-year average EBITDA growth rate is 50.4%, ranking better than 84.22% of 830 companies in the same industry.
ROIC vs WACC
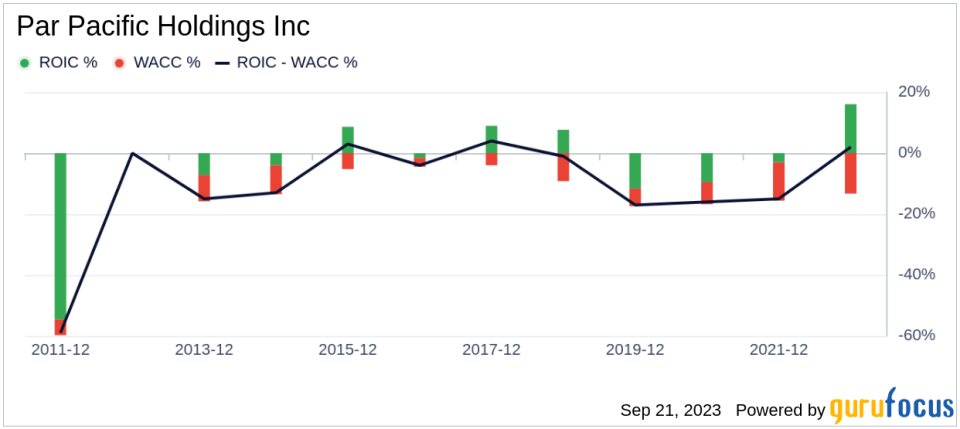
Comparing a company's return on invested capital (ROIC) to its weighted cost of capital (WACC) is another way to evaluate its profitability. ROIC measures how well a company generates cash flow relative to the capital it has invested in its business. The WACC is the rate that a company is expected to pay on average to all its security holders to finance its assets. If the ROIC is higher than the WACC, it indicates that the company is creating value for shareholders. Over the past 12 months, Par Pacific Holdings' ROIC was 24.3, while its WACC came in at 13.34.
Conclusion
In summary, Par Pacific Holdings' stock seems to be modestly overvalued. The company's financial condition is fair, and its profitability is also fair. Its growth ranks better than 84.22% of 830 companies in the Oil & Gas industry. To learn more about Par Pacific Holdings stock, you can check out its 30-Year Financials here.
To find out high-quality companies that may deliver above-average returns, please check out GuruFocus High Quality Low Capex Screener.
This article first appeared on GuruFocus.
