Unveiling Qorvo (QRVO)'s Value: Is It Really Priced Right? A Comprehensive Guide
Qorvo Inc (NASDAQ:QRVO) experienced a daily gain of 2.29% and a 3-month loss of -1.56%. The company reported a Loss Per Share of $0.17. This article aims to answer the question: Is Qorvo's stock modestly undervalued? The following analysis will shed light on QRVO's valuation, inviting readers to delve into the company's financials and market performance.
Company Introduction
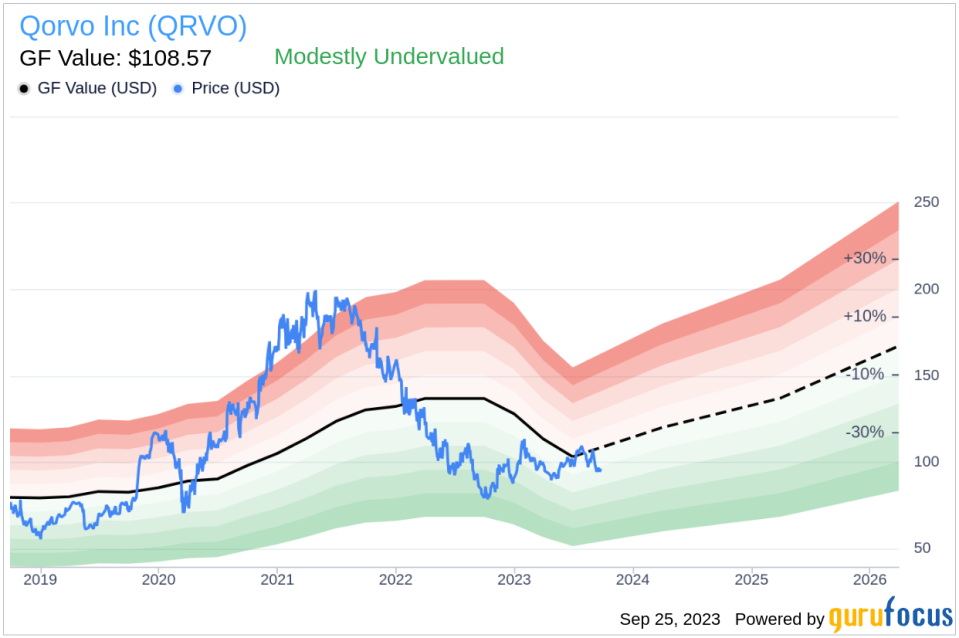
Qorvo Inc (NASDAQ:QRVO) is the combined entity of RF Micro Devices and TriQuint Semiconductor, merging in January 2015. The company specializes in radio frequency filters, power amplifiers, and front-end modules used in many of the world's most advanced smartphones. Qorvo also has a suite of products sold into a variety of non-smartphone end markets, such as wireless base stations, cable TV and networking equipment, infrastructure, and military applications. The company's stock price currently stands at $96.29, while the GF Value, an estimation of fair value, is $108.57.
Understanding the GF Value
The GF Value is a proprietary measure of a stock's intrinsic value, computed based on historical trading multiples, a GuruFocus adjustment factor based on past performance and growth, and future business performance estimates. The GF Value Line on our summary page gives an overview of the fair value that the stock should be traded at. If the stock price is significantly above the GF Value Line, it is overvalued and its future return is likely to be poor. On the other hand, if it is significantly below the GF Value Line, its future return will likely be higher.
Based on the GF Value calculation, Qorvo (NASDAQ:QRVO) stock is estimated to be modestly undervalued. With a market cap of $9.40 billion at its current price per share, Qorvo's future return is likely to be higher than its business growth due to its relatively undervalued status.
Link: These companies may deliever higher future returns at reduced risk.
Financial Strength
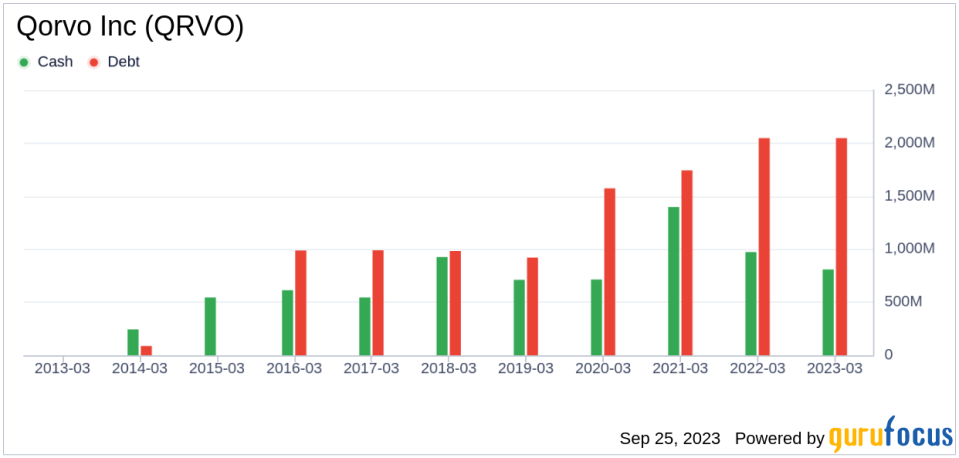
Investing in companies with poor financial strength has a higher risk of permanent loss of capital. Thus, it is important to carefully review the financial strength of a company before deciding whether to buy its stock. Looking at the cash-to-debt ratio and interest coverage is a great starting point for understanding the financial strength of a company. Qorvo has a cash-to-debt ratio of 0.36, which is worse than 82.74% of 904 companies in the Semiconductors industry. GuruFocus ranks the overall financial strength of Qorvo at 6 out of 10, which indicates that the financial strength of Qorvo is fair.
Profitability and Growth
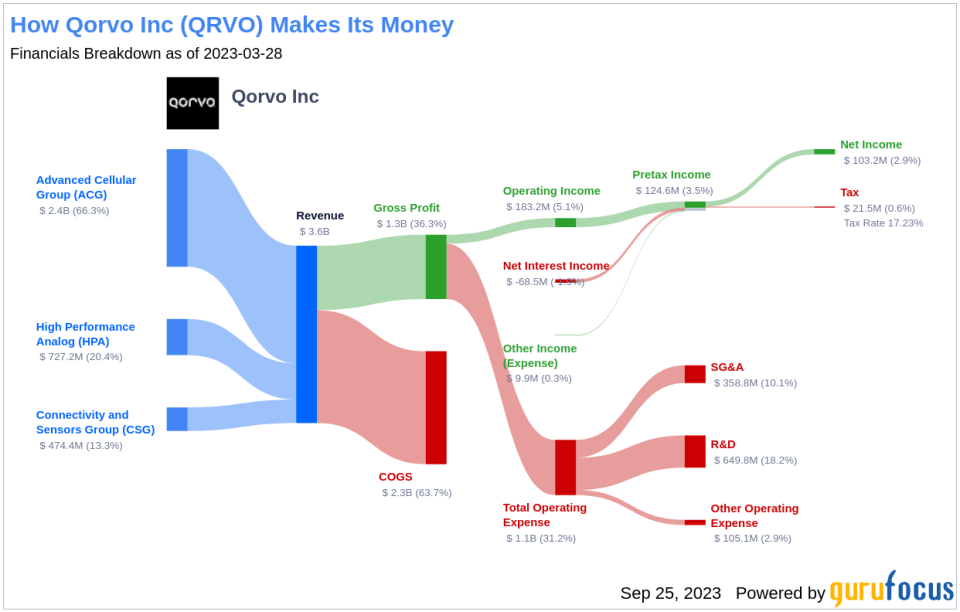
Investing in profitable companies, especially those that have demonstrated consistent profitability over the long term, poses less risk. A company with high profit margins is also typically a safer investment than one with low profit margins. Qorvo has been profitable 7 over the past 10 years. Over the past twelve months, the company had a revenue of $3.20 billion and Loss Per Share of $0.17. Its operating margin is 1.04%, which ranks worse than 67.02% of 952 companies in the Semiconductors industry. Overall, GuruFocus ranks the profitability of Qorvo at 7 out of 10, which indicates fair profitability.
Growth is probably the most important factor in the valuation of a company. GuruFocus research has found that growth is closely correlated with the long term stock performance of a company. A faster growing company creates more value for shareholders, especially if the growth is profitable. The 3-year average annual revenue growth of Qorvo is 8.5%, which ranks worse than 58.94% of 872 companies in the Semiconductors industry. The 3-year average EBITDA growth rate is -12.7%, which ranks worse than 87.1% of 775 companies in the Semiconductors industry.
ROIC vs WACC
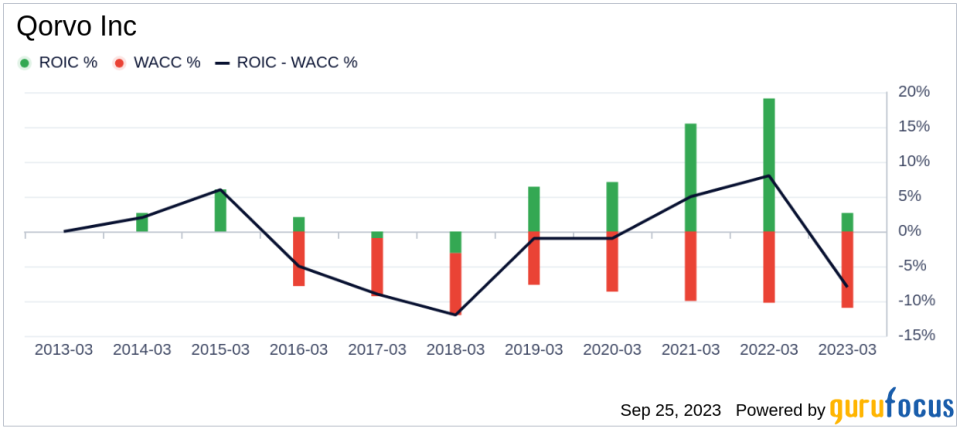
Another way to evaluate a company's profitability is to compare its return on invested capital (ROIC) to its weighted cost of capital (WACC). Return on invested capital (ROIC) measures how well a company generates cash flow relative to the capital it has invested in its business. The weighted average cost of capital (WACC) is the rate that a company is expected to pay on average to all its security holders to finance its assets. If the ROIC is higher than the WACC, it indicates that the company is creating value for shareholders. Over the past 12 months, Qorvo's ROIC was 0.83, while its WACC came in at 11.12.
Conclusion
In summary, the stock of Qorvo (NASDAQ:QRVO) is estimated to be modestly undervalued. The company's financial condition is fair and its profitability is fair. Its growth ranks worse than 87.1% of 775 companies in the Semiconductors industry. To learn more about Qorvo stock, you can check out its 30-Year Financials here.
To find out the high quality companies that may deliver above average returns, please check out GuruFocus High Quality Low Capex Screener.
This article first appeared on GuruFocus.
