Unveiling Rambus (RMBS)'s Value: Is It Really Priced Right? A Comprehensive Guide
Today's performance of Rambus Inc (NASDAQ:RMBS) stock shows a 2.93% gain, with a 3-month loss of -9.94%. Despite the recent losses, the company's Earnings Per Share (EPS) stands at 1.69. The question that arises is: Is Rambus (NASDAQ:RMBS) significantly overvalued? This article aims to analyze the company's valuation, encouraging readers to delve into the following comprehensive analysis.
Introduction to Rambus Inc (NASDAQ:RMBS)
Rambus Inc is a semiconductor solutions provider that specializes in high-speed, high-security computer chips and Silicon intellectual property. Their key products include memory interface chips designed for high speed and efficiency, silicon IP offering high-speed memory, and chip-to-chip connection technology. The company's operations predominantly span across the United States, Taiwan, Asia-Other, Japan, and Singapore.
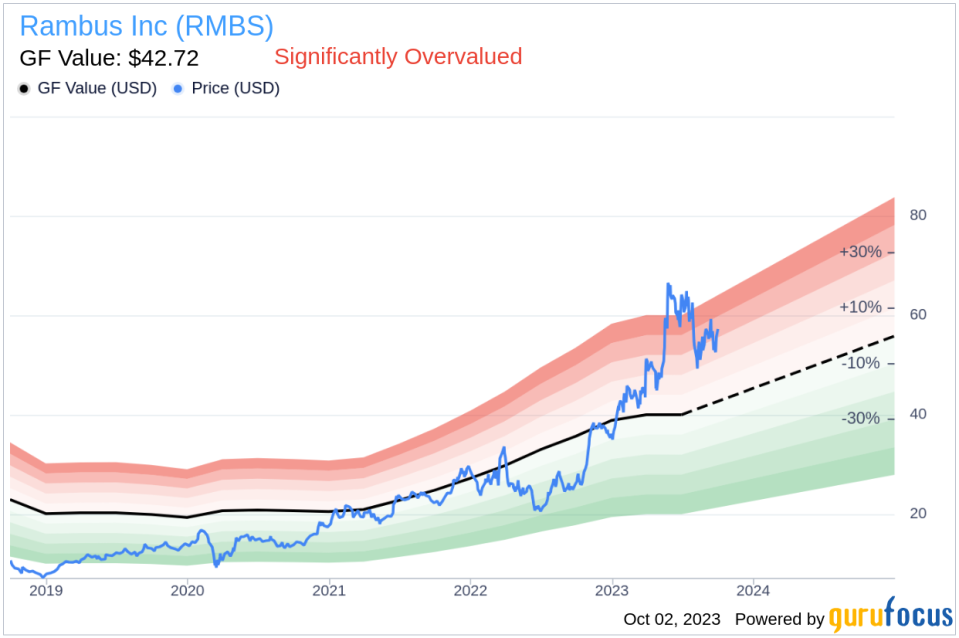
At present, the stock price of Rambus (NASDAQ:RMBS) is $57.43 per share, with a market cap of $6.30 billion. This figure is contrasted by the GF Value of $42.72, an estimation of the fair value of the company's stock. The following sections will provide a detailed analysis of the company's value, interweaving financial assessment with essential company details.
Understanding the GF Value
The GF Value is a proprietary measure of a stock's intrinsic value, computed considering historical trading multiples, a GuruFocus adjustment factor based on past performance and growth, and future business performance estimates. The GF Value Line denotes the stock's ideal fair trading value.
According to the GuruFocus Value calculation, Rambus (NASDAQ:RMBS) appears to be significantly overvalued. If the price of a stock is significantly above the GF Value Line, it is overvalued, and its future return is likely to be poor. Conversely, if it is significantly below the GF Value Line, its future return will likely be higher. Considering Rambus's current price and market cap, the stock seems to be significantly overvalued.
Given that Rambus is significantly overvalued, the long-term return of its stock is likely to be much lower than its future business growth.
Link: These companies may deliver higher future returns at reduced risk.
Financial Strength of Rambus (NASDAQ:RMBS)
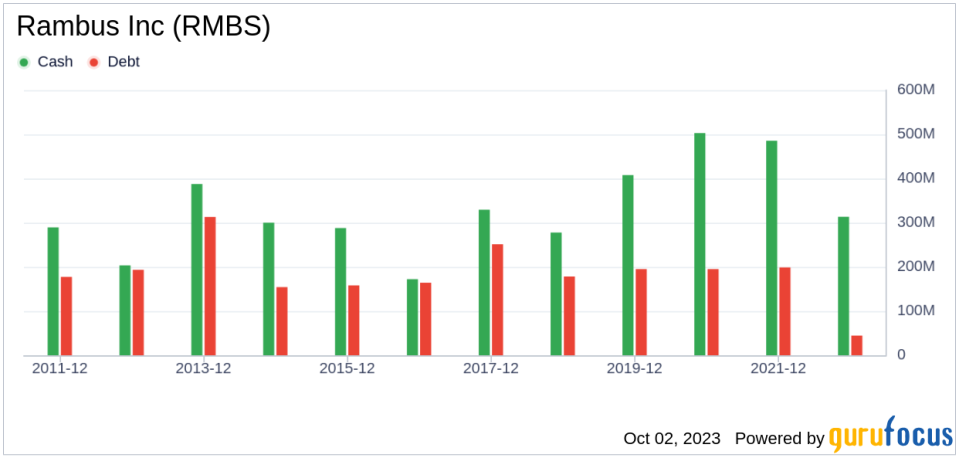
Companies with poor financial strength pose a high risk of permanent capital loss to investors. To avoid this, it's crucial to review a company's financial strength before deciding to purchase shares. Key indicators of financial strength include the cash-to-debt ratio and interest coverage. Rambus has a cash-to-debt ratio of 10.64, which ranks better than 71.24% of 904 companies in the Semiconductors industry. The overall financial strength of Rambus is 9 out of 10, indicating strong financial health.
Profitability and Growth of Rambus (NASDAQ:RMBS)
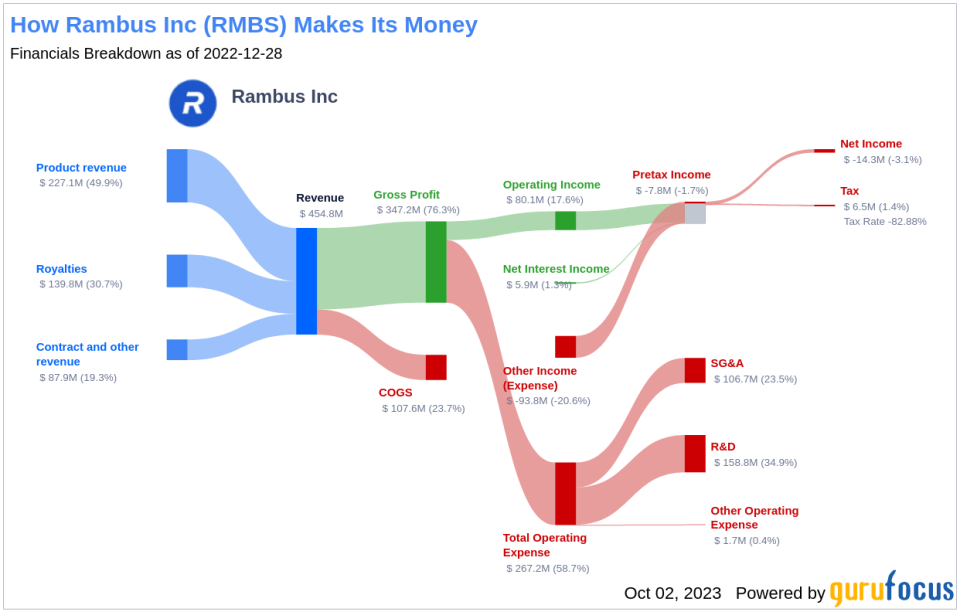
Investing in profitable companies, especially those that have demonstrated consistent profitability over the long term, poses less risk. Rambus has been profitable 4 over the past 10 years. Over the past twelve months, the company had a revenue of $468.20 million and Earnings Per Share (EPS) of $1.69. Its operating margin is 16.52%, which ranks better than 75.68% of 954 companies in the Semiconductors industry. Overall, GuruFocus ranks the profitability of Rambus at 6 out of 10, indicating fair profitability.
Growth is one of the most important factors in the valuation of a company. According to GuruFocus research, companies that grow faster create more value for shareholders, especially if that growth is profitable. The average annual revenue growth of Rambus is 26.5%, which ranks better than 79.98% of 874 companies in the Semiconductors industry. However, the 3-year average EBITDA growth is 0%, which ranks worse than 0% of 776 companies in the Semiconductors industry.
ROIC vs WACC Comparison
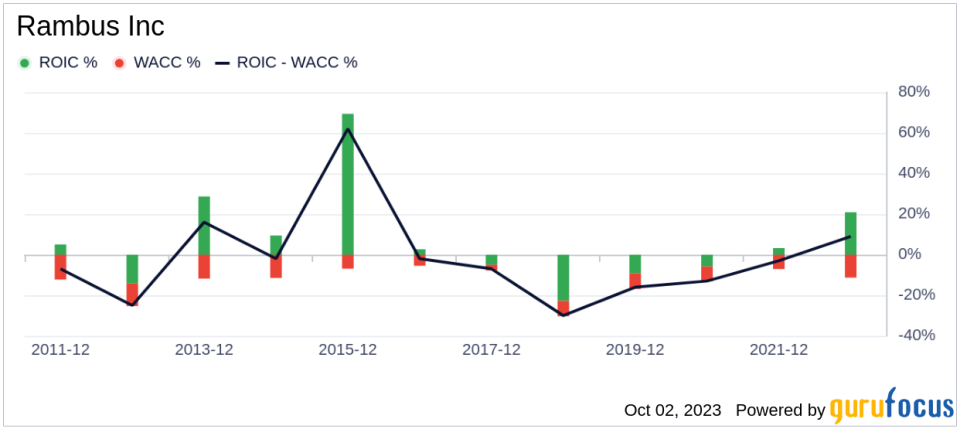
Comparing a company's return on invested capital (ROIC) to its weighted cost of capital (WACC) is another way to evaluate its profitability. Return on invested capital (ROIC) measures how well a company generates cash flow relative to the capital it has invested in its business. The weighted average cost of capital (WACC) is the rate that a company is expected to pay on average to all its security holders to finance its assets. If the ROIC is higher than the WACC, it indicates that the company is creating value for shareholders. Over the past 12 months, Rambus's ROIC was 59.17, while its WACC came in at 12.17.
Conclusion
In summary, Rambus (NASDAQ:RMBS) appears to be significantly overvalued. The company's financial condition is strong, and its profitability is fair. However, its growth ranks worse than 0% of 776 companies in the Semiconductors industry. For more information about Rambus stock, check out its 30-Year Financials here.
To find high-quality companies that may deliver above-average returns, visit GuruFocus High Quality Low Capex Screener.
This article first appeared on GuruFocus.
