Unveiling Silicon Motion Technology (SIMO)'s Value: Is It Really Priced Right? A Comprehensive Guide
As of October 6, 2023, Silicon Motion Technology Corp (NASDAQ:SIMO) exhibited a daily gain of 2.25%, despite a 3-month loss of 16.42%. The company's Earnings Per Share (EPS) stood at 2.63. But the question remains: is the stock fairly valued? In this article, we delve into the valuation analysis of Silicon Motion Technology, providing an in-depth examination of its financial performance and market value.
Company Overview
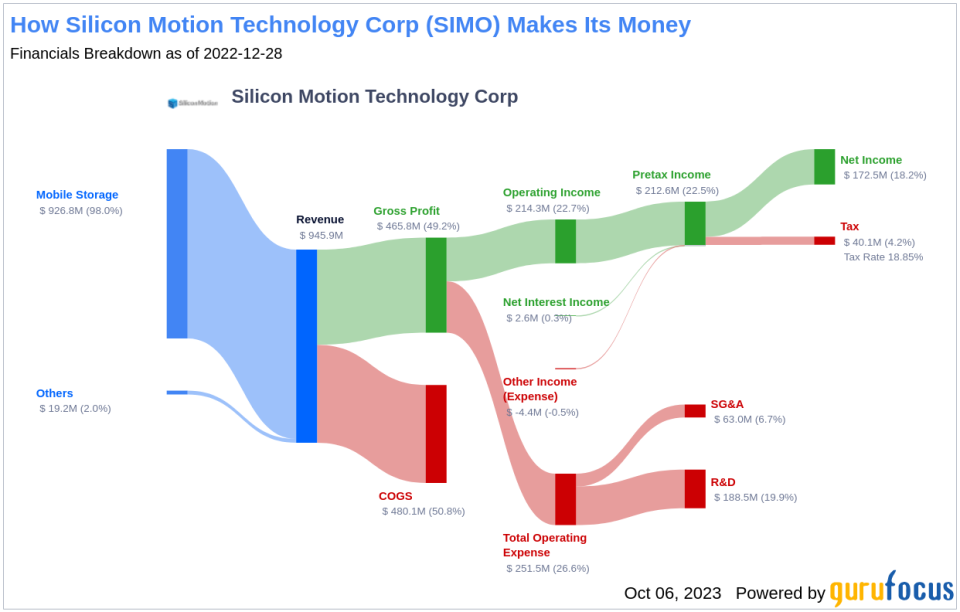
Silicon Motion Technology Corp is a key player in the semiconductor industry, specializing in the design, development, and marketing of controllers for managing NAND flash used in embedded storage applications such as eMMC embedded memory. The company's products are widely utilized in Personal Computing, Smartphone/Tablet/CE, Flash Card/USB Flash Drive, Industrial and Embedded, Automotive, and Enterprise and Data centers. With a geographical footprint spanning Taiwan, the United States, Korea, China, Singapore, Malaysia, and other regions, Silicon Motion Technology's market cap is currently $1.80 billion.
Here is a breakdown of the company's income:
Understanding GF Value
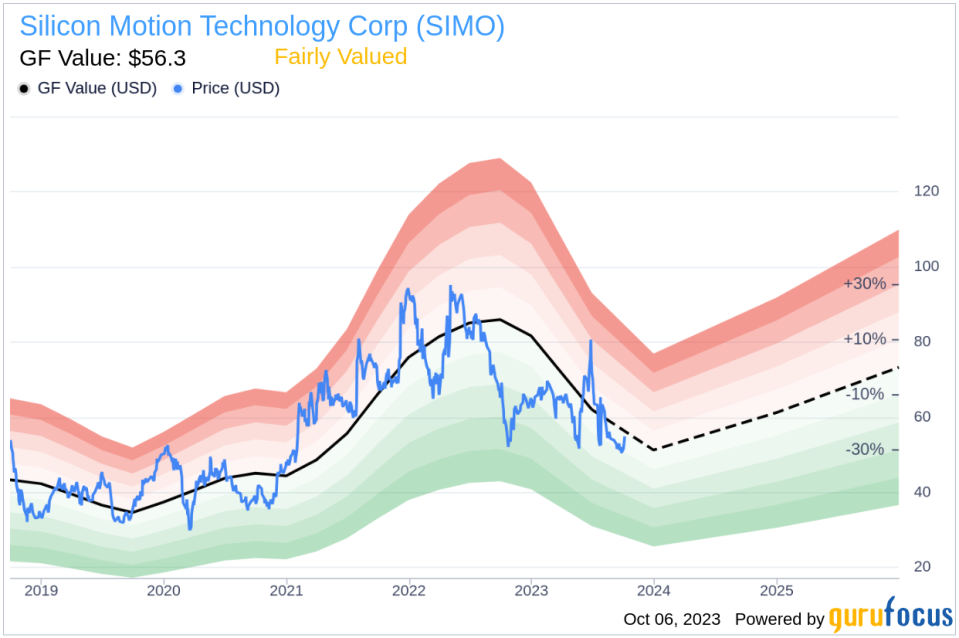
The GF Value is a unique measure of a stock's intrinsic value, calculated based on historical trading multiples, a GuruFocus adjustment factor based on past returns and growth, and future estimates of business performance. The GF Value Line on our summary page offers a snapshot of the stock's fair trading value.
For Silicon Motion Technology (NASDAQ:SIMO), the GF Value indicates that the stock is fairly valued. This assessment is based on the company's historical multiples, internal adjustments based on past business growth, and analyst estimates of future business performance. If the stock's share price is significantly above the GF Value Line, it may be overvalued, suggesting poor future returns. Conversely, if the stock's share price is significantly below the GF Value Line, it may be undervalued, implying high future returns. Currently, at $55 per share, Silicon Motion Technology appears to be fairly valued.
Given its fair valuation, the long-term return of Silicon Motion Technology's stock is likely to align closely with the rate of its business growth.
Link: These companies may deliver higher future returns at reduced risk.
Financial Strength
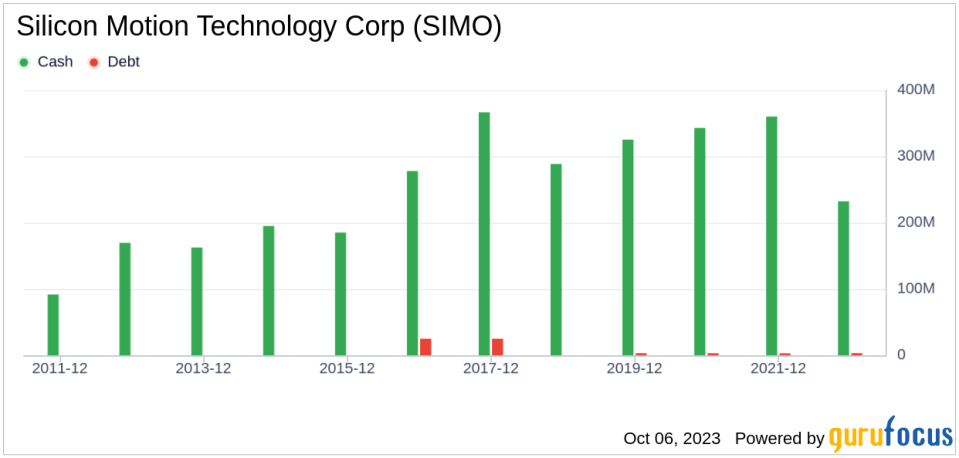
Investing in companies with poor financial strength poses a high risk of permanent capital loss. To avoid this, it's crucial to review a company's financial strength before deciding to purchase shares. Both the cash-to-debt ratio and interest coverage are great indicators of a company's financial strength. Silicon Motion Technology boasts a cash-to-debt ratio of 10000, ranking better than 99.89% of 904 companies in the Semiconductors industry. This indicates that the financial strength of Silicon Motion Technology is robust.
Here's a look at the debt and cash of Silicon Motion Technology over the past years:
Profitability and Growth
Investing in profitable companies, especially those that have demonstrated consistent profitability over the long term, poses less risk. A company with high profit margins is also typically a safer investment than one with low profit margins. Silicon Motion Technology has been profitable 10 over the past 10 years. Over the past twelve months, the company had a revenue of $716 million and Earnings Per Share (EPS) of $2.63. Its operating margin is 12.21%, which ranks better than 66.56% of 954 companies in the Semiconductors industry. Overall, GuruFocus ranks the profitability of Silicon Motion Technology at 10 out of 10, which indicates strong profitability.
Growth is probably the most important factor in the valuation of a company. GuruFocus research has found that growth is closely correlated with the long term stock performance of a company. A faster growing company creates more value for shareholders, especially if the growth is profitable. The 3-year average annual revenue growth of Silicon Motion Technology is 29.8%, which ranks better than 84.1% of 874 companies in the Semiconductors industry. The 3-year average EBITDA growth rate is 42.1%, which ranks better than 74.58% of 775 companies in the Semiconductors industry.
ROIC vs WACC
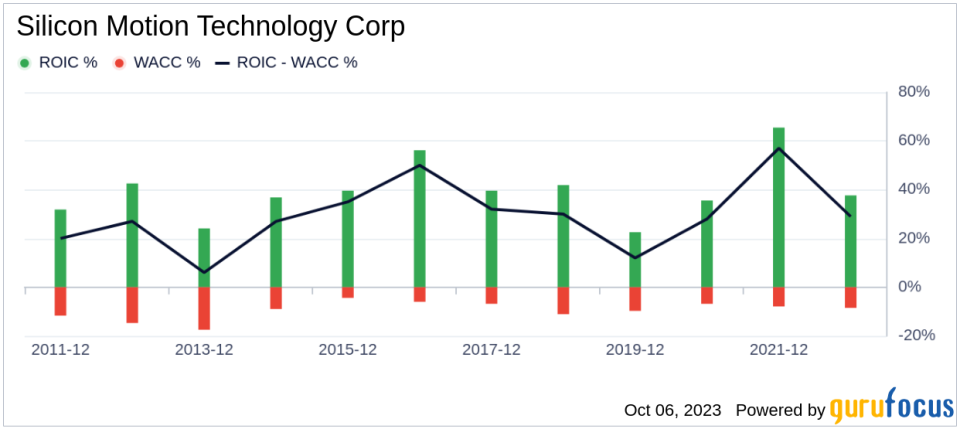
Another way to evaluate a company's profitability is to compare its return on invested capital and the weighted cost of capital. Return on invested capital (ROIC) measures how well a company generates cash flow relative to the capital it has invested in its business. The weighted average cost of capital (WACC) is the rate that a company is expected to pay on average to all its security holders to finance its assets. We want to have the return on invested capital higher than the weighted cost of capital. For the past 12 months, Silicon Motion Technology's return on invested capital is 13.24, and its cost of capital is 9.51.
The historical ROIC vs WACC comparison of Silicon Motion Technology is shown below:
Conclusion
After a comprehensive evaluation, Silicon Motion Technology (NASDAQ:SIMO) stock appears to be fairly valued. The company's financial condition is strong, and its profitability is robust. Its growth ranks better than 74.58% of 775 companies in the Semiconductors industry. To learn more about Silicon Motion Technology stock, you can check out its 30-Year Financials here.
To discover high-quality companies that may deliver above-average returns, check out GuruFocus High Quality Low Capex Screener.
This article, generated by GuruFocus, is designed to provide general insights and is not tailored financial advice. Our commentary is rooted in historical data and analyst projections, utilizing an impartial methodology, and is not intended to serve as specific investment guidance. It does not formulate a recommendation to purchase or divest any stock and does not consider individual investment objectives or financial circumstances. Our objective is to deliver long-term, fundamental data-driven analysis. Be aware that our analysis might not incorporate the most recent, price-sensitive company announcements or qualitative information. GuruFocus holds no position in the stocks mentioned herein.
This article first appeared on GuruFocus.
