Unveiling Smartsheet (SMAR)'s Value: Is It Really Priced Right? A Comprehensive Guide
Smartsheet Inc (NYSE:SMAR), a cloud-based platform for work execution, has seen a daily loss of -3.2 %, and a 3-month gain of 2.94%. Despite a Loss Per Share of 1.12, the stock appears to be significantly undervalued based on our valuation analysis. But is this truly the case? This article delves into the financials of Smartsheet (NYSE:SMAR) to offer a comprehensive analysis of its intrinsic value.
Company Overview
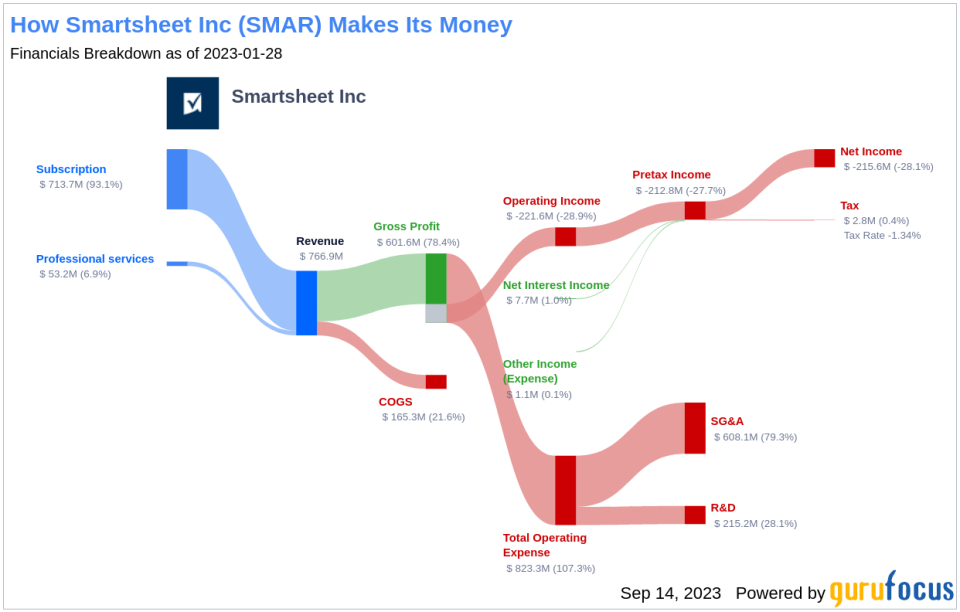
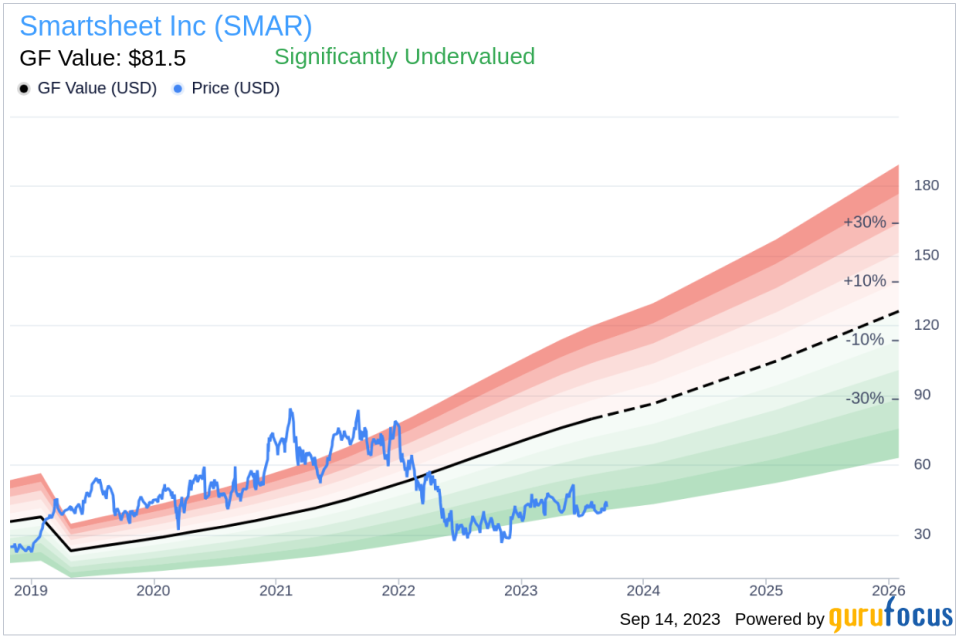
Smartsheet Inc provides a platform that enables teams and organizations to plan, capture, manage, automate, and report on work. Its services range from streamlining facilities management to managing customer experiences and budgets. The majority of its revenue comes from subscriptions, primarily within the United States. With a current stock price of $42.04, Smartsheet (NYSE:SMAR) has a market cap of $5.70 billion. When compared to its fair value (GF Value) of $81.5, the stock appears to be significantly undervalued.
Understanding GF Value
The GF Value is a measure of the intrinsic value of a stock, calculated based on historical multiples, a GuruFocus adjustment factor, and future business performance estimates. The GF Value Line on our summary page gives an overview of the fair value that the stock should be traded at. If the stock price is significantly above the GF Value Line, it is overvalued and its future return is likely to be poor. On the other hand, if it is significantly below the GF Value Line, its future return will likely be higher.
According to our valuation method, Smartsheet (NYSE:SMAR) appears to be significantly undervalued. The stock's fair value is determined by historical multiples, internal adjustments based on past business growth, and analyst estimates of future business performance. At its current price of $42.04 per share, Smartsheet has a market cap of $5.70 billion and appears to be significantly undervalued. As such, the long-term return of its stock is likely to be much higher than its business growth.
Link: These companies may deliever higher future returns at reduced risk.
Financial Strength
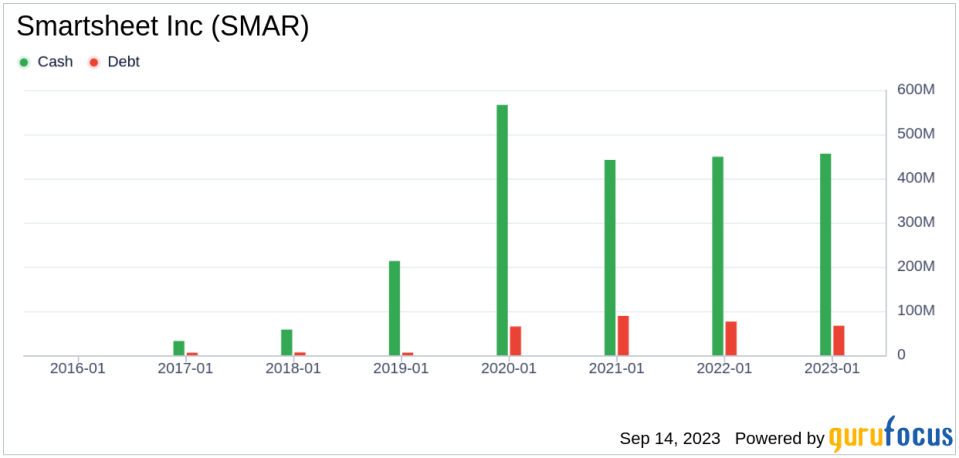
Before investing in a company, it's crucial to assess its financial strength. Companies with poor financial strength pose a higher risk of permanent loss. The cash-to-debt ratio and interest coverage are great indicators of a company's financial strength. Smartsheet has a cash-to-debt ratio of 9.52, better than 65.18% of 2751 companies in the Software industry. Overall, Smartsheet's financial strength is fair, with a score of 7 out of 10.
Profitability and Growth
Investing in profitable companies, especially those with consistent profitability over the long term, is less risky. High-profit margin companies are usually safer investments than those with low profit margins. Smartsheet has been profitable 0 over the past 10 years. Over the past twelve months, the company had a revenue of $867.40 million and a Loss Per Share of $1.12. Its operating margin is -17.9%, ranking worse than 72.24% of 2731 companies in the Software industry. Overall, the profitability of Smartsheet is ranked 3 out of 10, indicating poor profitability.
Growth is a crucial factor in the valuation of a company. The faster a company is growing, the more likely it is to be creating value for shareholders, especially if the growth is profitable. The 3-year average annual revenue growth rate of Smartsheet is 35%, better than 87.98% of 2413 companies in the Software industry. However, the 3-year average EBITDA growth rate is -23.7%, ranking worse than 84.13% of 2010 companies in the Software industry.
ROIC vs WACC
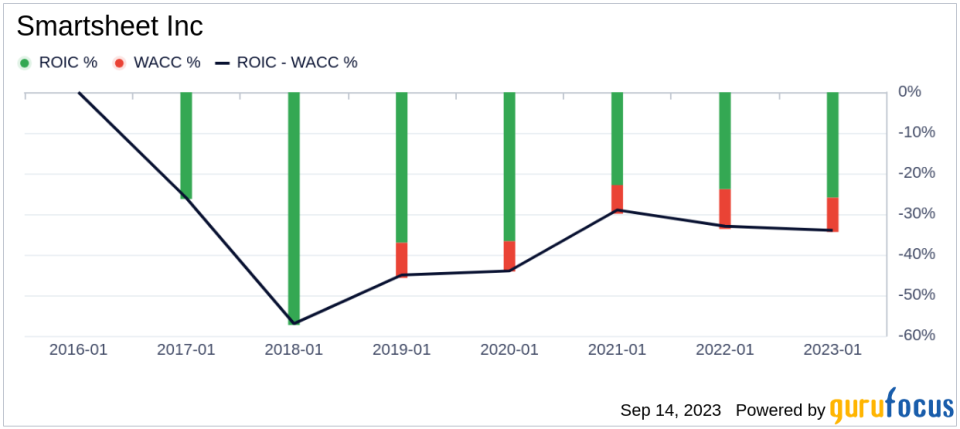
Comparing a company's return on invested capital (ROIC) and the weighted cost of capital (WACC) is another way to assess its profitability. The ROIC measures how well a company generates cash flow relative to the capital it has invested in its business. The WACC is the rate that a company is expected to pay on average to all its security holders to finance its assets. Ideally, the ROIC should be higher than the WACC. For the past 12 months, Smartsheet's ROIC is -18.29, and its WACC is 7.2.
Conclusion
Overall, Smartsheet (NYSE:SMAR) stock appears to be significantly undervalued. The company's financial condition is fair, but its profitability is poor. Its growth ranks worse than 84.13% of 2010 companies in the Software industry. To learn more about Smartsheet stock, you can check out its 30-Year Financials here.
To find out the high-quality companies that may deliver above-average returns, please check out GuruFocus High Quality Low Capex Screener.
This article first appeared on GuruFocus.
