Unveiling Targa Resources (TRGP)'s Value: Is It Really Priced Right? A Comprehensive Guide
On October 4, 2023, Targa Resources Corp (NYSE:TRGP) experienced a day's loss of 2.66%, following a 3-month gain of 7.24%. The stock's Earnings Per Share (EPS) (EPS) stands at 3.69. But the question remains, is the stock modestly overvalued? This article presents an in-depth valuation analysis of Targa Resources (NYSE:TRGP), providing insights that could guide your investment decisions. So, let's delve into the details.
Company Overview
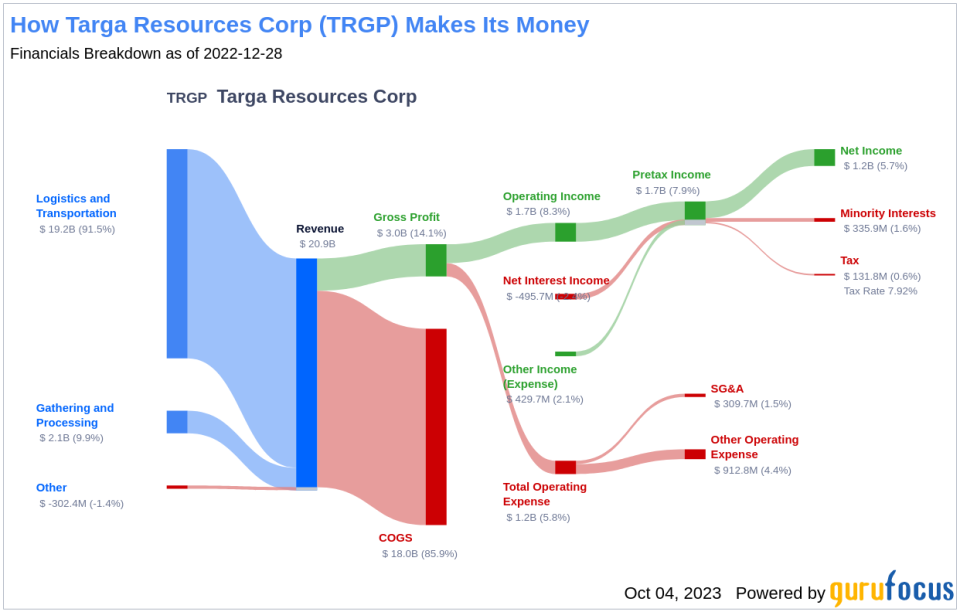
Targa Resources Corp (NYSE:TRGP) is a midstream firm primarily operating gathering and processing assets with substantial positions in the Permian, Stack, Scoop, and Bakken plays. It boasts 843,000 barrels a day of gross fractionation capacity at Mont Belvieu and operates a liquefied petroleum gas export terminal. The Grand Prix natural gas liquids pipeline recently entered full service. With a current stock price of $79.89, Targa Resources has a market cap of $17.90 billion, indicating a modest overvaluation according to the GuruFocus Value.
Understanding The GF Value
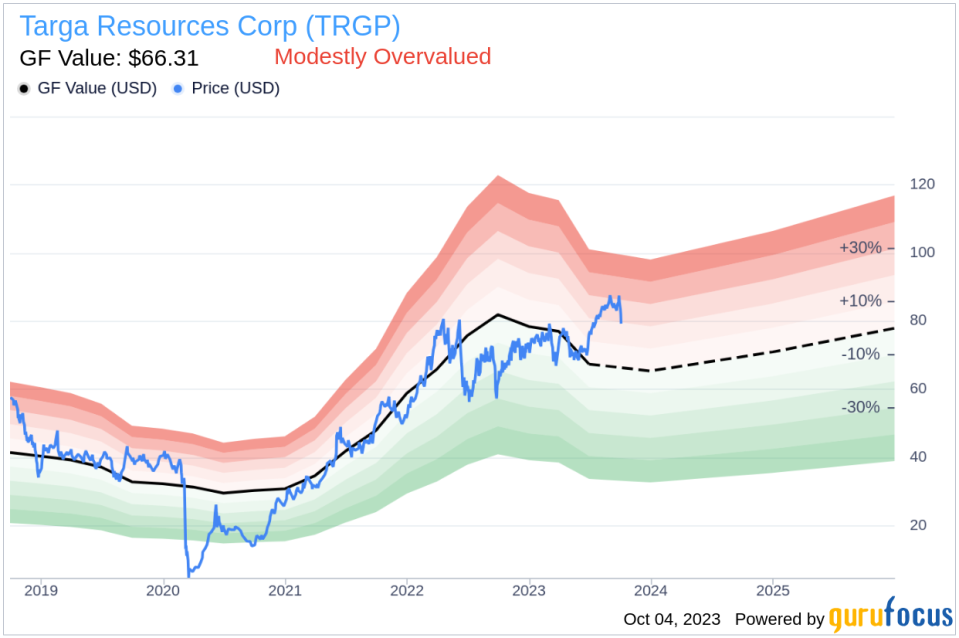
The GF Value represents the current intrinsic value of a stock derived from our proprietary method. It is calculated based on historical multiples that the stock has traded at, a GuruFocus adjustment factor based on the company's past performance and growth, and future estimates of the business performance. If the price of a stock is significantly above the GF Value Line, it is overvalued and its future return is likely to be poor. On the other hand, if it is significantly below the GF Value Line, its future return will likely be higher.
For Targa Resources, the stock appears to be modestly overvalued based on the GuruFocus Value calculation. This suggests that the long-term return of its stock is likely to be lower than its business growth.
Link: These companies may deliver higher future returns at reduced risk.
Assessing Financial Strength
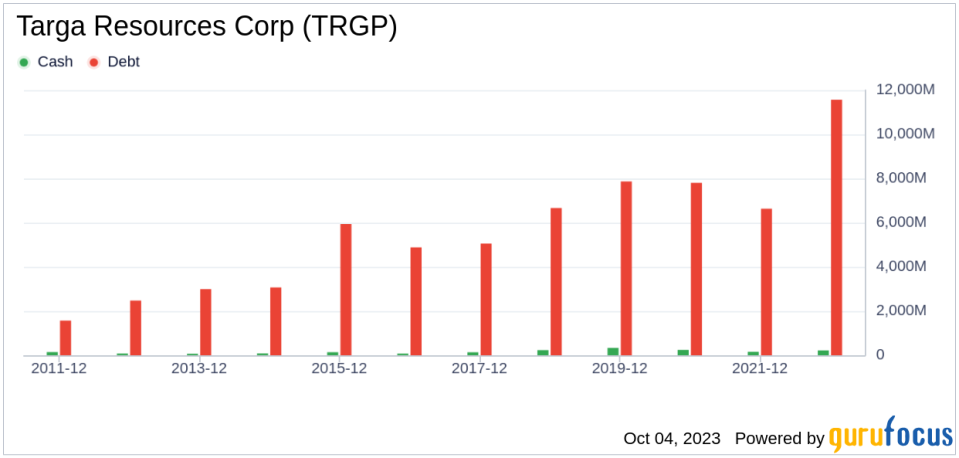
Checking the financial strength of a company before buying its stock is crucial. Investing in companies with poor financial strength have a higher risk of permanent loss. A look at the cash-to-debt ratio and interest coverage can provide insights into the financial strength of a company. Targa Resources has a cash-to-debt ratio of 0.01, which is worse than 95.61% of 1026 companies in the Oil & Gas industry. The overall financial strength of Targa Resources is 4 out of 10, indicating that its financial strength is poor.
Profitability and Growth
Investing in profitable companies carries less risk, especially in companies that have demonstrated consistent profitability over the long term. Targa Resources has been profitable 7 years over the past 10 years. During the past 12 months, the company had revenues of $17.80 billion and Earnings Per Share (EPS) of $3.69. Its operating margin of 13.83% is better than 59.75% of 979 companies in the Oil & Gas industry. Overall, GuruFocus ranks Targa Resources's profitability as fair.
One of the most important factors in the valuation of a company is growth. Companies that grow faster create more value for shareholders, especially if that growth is profitable. The average annual revenue growth of Targa Resources is 34.4%, which ranks better than 86.63% of 860 companies in the Oil & Gas industry. The 3-year average EBITDA growth is 36.7%, which ranks better than 75.06% of 826 companies in the Oil & Gas industry.
ROIC vs. WACC
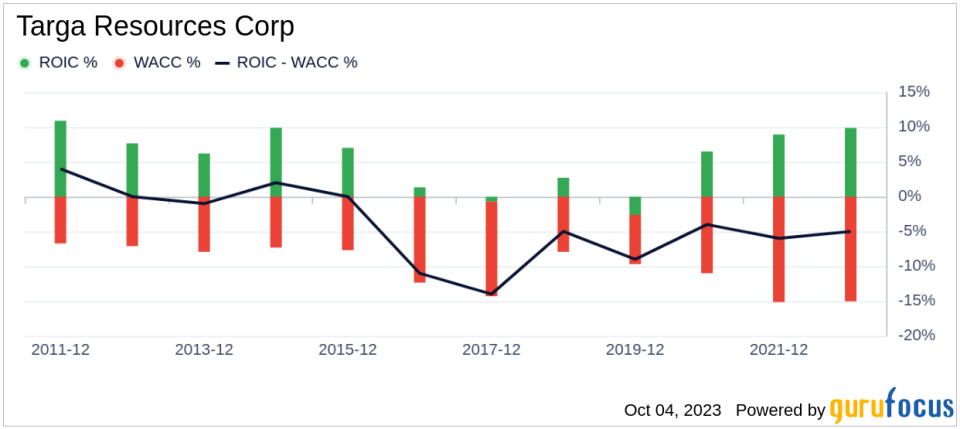
Return on invested capital (ROIC) measures how well a company generates cash flow relative to the capital it has invested in its business. The weighted average cost of capital (WACC) is the rate that a company is expected to pay on average to all its security holders to finance its assets. For the past 12 months, Targa Resources's return on invested capital is 12.41, and its cost of capital is 10.01.
Conclusion
In summary, the stock of Targa Resources (NYSE:TRGP) gives every indication of being modestly overvalued. The company's financial condition is poor, and its profitability is fair. Its growth ranks better than 75.06% of 826 companies in the Oil & Gas industry. To learn more about Targa Resources stock, you can check out its 30-Year Financials here.
To find out the high-quality companies that may deliver above-average returns, please check out GuruFocus High Quality Low Capex Screener.
This article first appeared on GuruFocus.
