Unveiling Tronox Holdings PLC (TROX)'s Value: Is It Really Priced Right? A Comprehensive Guide
Tronox Holdings PLC (NYSE:TROX), a leading manufacturer of TiO2 pigment, has recently seen a daily loss of 3.59%, yet it boasts a 3-month gain of 6.8%. Despite a Loss Per Share of 0.89, the question arises: is the stock modestly undervalued? This comprehensive analysis aims to answer this question by examining the company's financial strength, profitability, and growth prospects. Read on to understand the intrinsic value of Tronox Holdings PLC (NYSE:TROX).
Introducing Tronox Holdings PLC
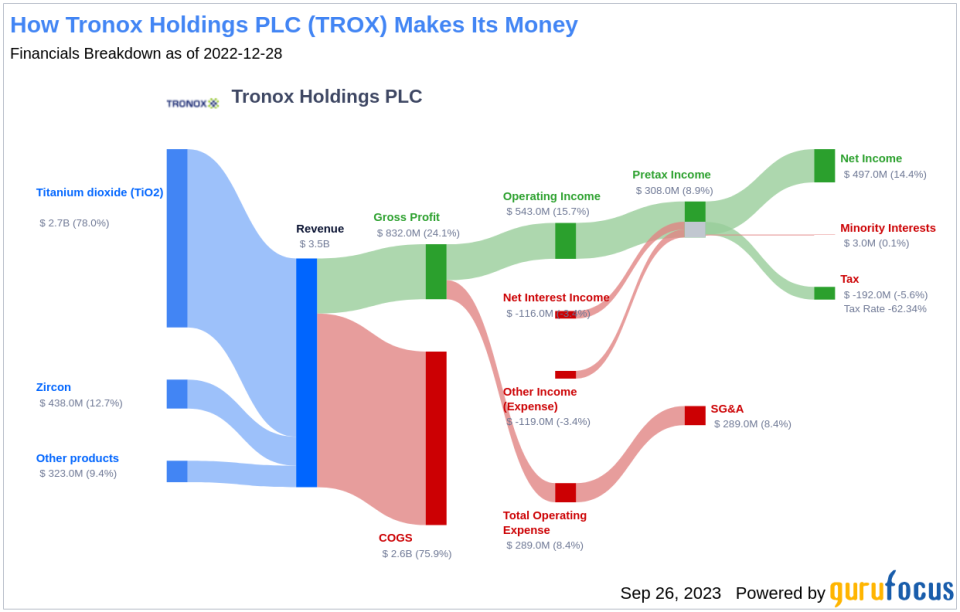
Tronox Holdings PLC is a vertically integrated manufacturer of TiO2 pigment. The company operates titanium-bearing mineral sand mines and beneficiation and smelting operations in Australia and South Africa. Its products are used in various industries, including paints and coatings, plastics, paper, and printing ink. With facilities in the United States, the Netherlands, and Western Australia, and mining operations in Western Australia and South Africa, Tronox Holdings PLC serves a vast global market.
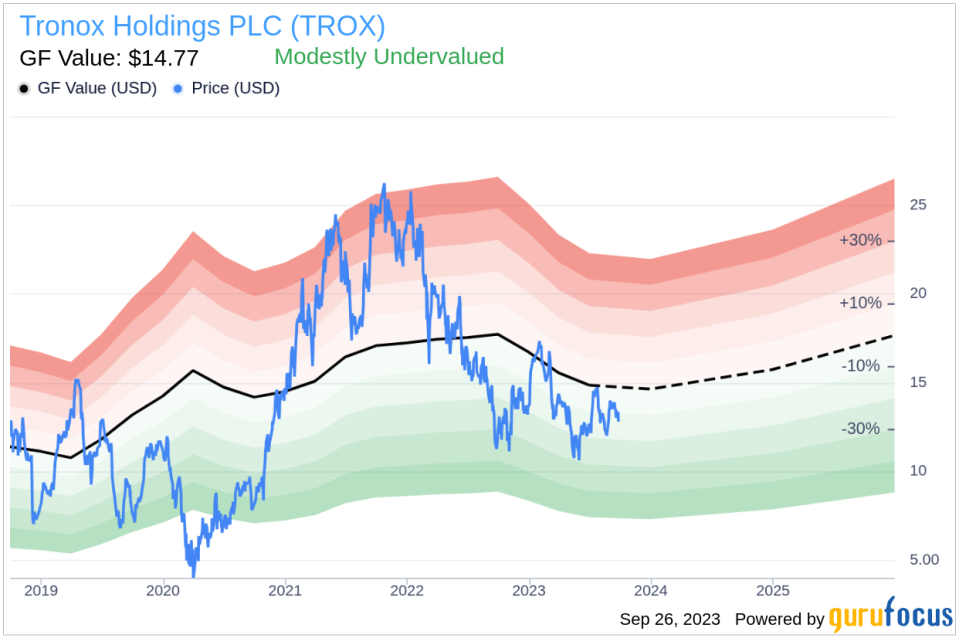
Comparing the stock price of $12.88 to the GF Value of $14.77, Tronox Holdings PLC appears to be modestly undervalued. But, to better understand this, we need to delve into the company's financials and market performance.
Understanding the GF Value of Tronox Holdings PLC
The GF Value is a proprietary measure that represents the current intrinsic value of a stock. This value is calculated based on historical trading multiples, a GuruFocus adjustment factor based on past performance and growth, and future business performance estimates. The GF Value Line provides an overview of the fair value at which the stock should ideally trade.
For Tronox Holdings PLC, the GF Value suggests that the stock is modestly undervalued. This conclusion is based on the company's historical multiples, past business growth, and analyst estimates of future business performance. If the share price is significantly above the GF Value Line, the stock may be overvalued and have poor future returns. Conversely, if the share price is significantly below the GF Value Line, the stock may be undervalued and have higher future returns.
Given that Tronox Holdings PLC is relatively undervalued, the long-term return of its stock is likely to be higher than its business growth.
Link: These companies may deliever higher future returns at reduced risk.
Evaluating the Financial Strength of Tronox Holdings PLC
Investing in companies with poor financial strength can lead to a higher risk of permanent capital loss. Therefore, it's crucial to review a company's financial strength before deciding to buy its stock. For Tronox Holdings PLC, the cash-to-debt ratio of 0.06 is worse than 92.29% of companies in the Chemicals industry. This indicates that the financial strength of Tronox Holdings PLC is poor.

Assessing the Profitability and Growth of Tronox Holdings PLC
Profitable companies, especially those with consistent profitability over the long term, are generally less risky investments. Tronox Holdings PLC has been profitable 3 times over the past 10 years, with an operating margin of 11.33%, ranking better than 71% of companies in the Chemicals industry. This indicates fair profitability.
Growth is a crucial factor in a company's valuation. The 3-year average annual revenue growth rate of Tronox Holdings PLC is 5.2%, which ranks worse than 65.38% of companies in the Chemicals industry. However, the 3-year average EBITDA growth rate is 17.1%, ranking better than 62.36% of companies in the industry, indicating solid growth.
Comparing ROIC and WACC
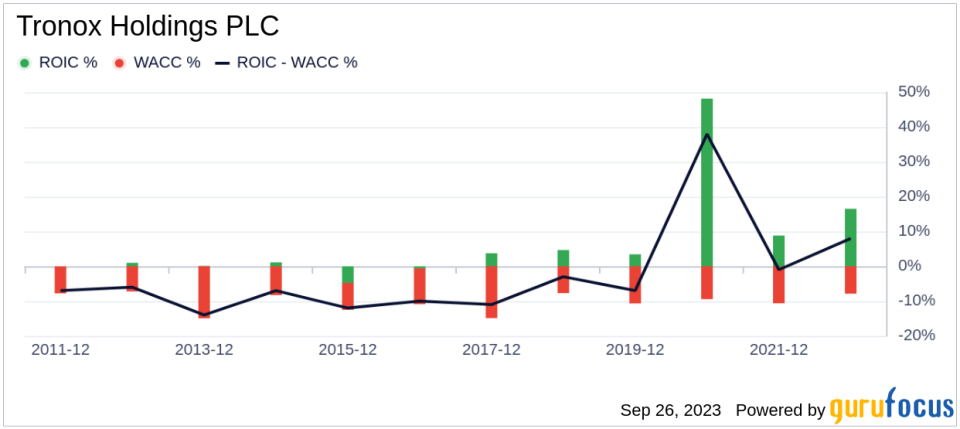
Another way to evaluate a company's profitability is to compare its return on invested capital (ROIC) to its weighted cost of capital (WACC). If the ROIC is higher than the WACC, it indicates that the company is creating value for shareholders. Over the past 12 months, Tronox Holdings PLC's ROIC was -4.07, while its WACC came in at 7.52.
Conclusion
Overall, Tronox Holdings PLC (NYSE:TROX) stock shows every sign of being modestly undervalued. The company's financial condition is poor, and its profitability is fair. Its growth ranks better than 62.36% of 1339 companies in the Chemicals industry. To learn more about Tronox Holdings PLC stock, you can check out its 30-Year Financials here.
To find out the high quality companies that may deliver above-average returns, please check out GuruFocus High Quality Low Capex Screener.
This article first appeared on GuruFocus.
