Unveiling Tyler Technologies (TYL)'s Value: Is It Really Priced Right? A Comprehensive Guide
Tyler Technologies Inc (NYSE:TYL) has recently seen a daily gain of 2.03%, though it has experienced a 3-month loss of -3.27%. With an Earnings Per Share (EPS) (EPS) of 3.87, the question arises: is the stock modestly undervalued? This article delves into a valuation analysis of Tyler Technologies, drawing on various financial metrics and industry trends. We invite you to read on and gain a deeper understanding of Tyler Technologies' financial standing and future prospects.
An Overview of Tyler Technologies
Tyler Technologies Inc provides a comprehensive suite of software solutions and services catering to the needs of cities, counties, schools, courts, and other local government entities. The company's key products include Munis, the core ERP system, Odyssey, the court management system, and payments. Additionally, Tyler Technologies offers an array of add-on modules and outsourced property tax assessment services.
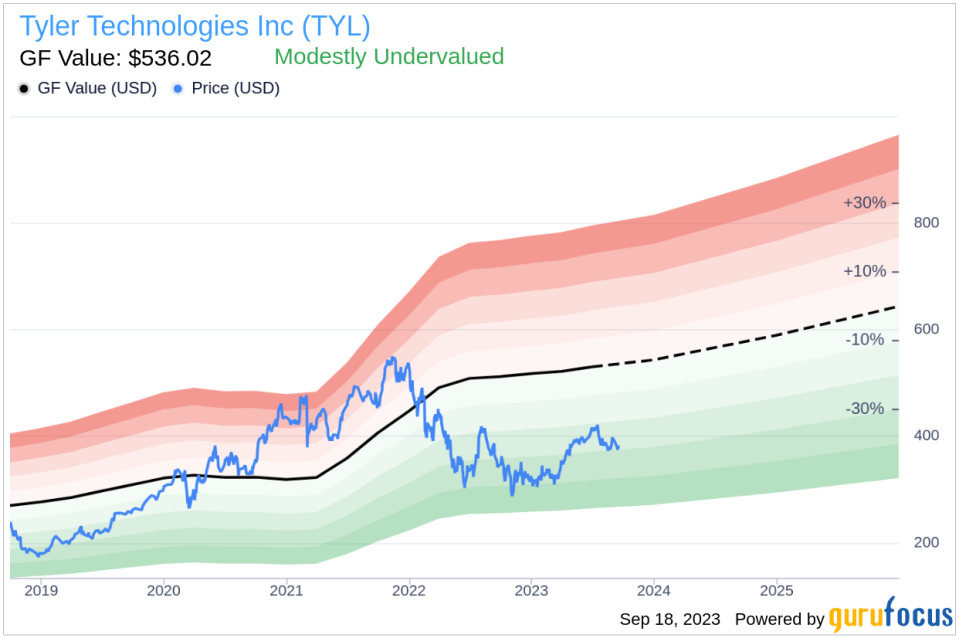
Currently, Tyler Technologies (NYSE:TYL) trades at $383 per share, with a market cap of $16.10 billion. The GF Value, an estimation of the stock's fair value, stands at $536.02. This comparison suggests that the stock may be modestly undervalued.
Understanding the GF Value
The GF Value is a proprietary measure of a stock's intrinsic value, calculated based on historical trading multiples, a GuruFocus adjustment factor, and future business performance estimates. The GF Value Line provides a representation of the stock's ideal trading value.
If the stock price significantly exceeds the GF Value Line, it may be overvalued, potentially leading to poor future returns. Conversely, if the stock price is significantly below the GF Value Line, the stock may be undervalued, likely resulting in higher future returns. Given Tyler Technologies' current price and market cap, the stock appears to be modestly undervalued.
Due to this undervaluation, the long-term return of Tyler Technologies' stock is likely to exceed its business growth.
Link: These companies may deliver higher future returns at reduced risk.
Financial Strength of Tyler Technologies
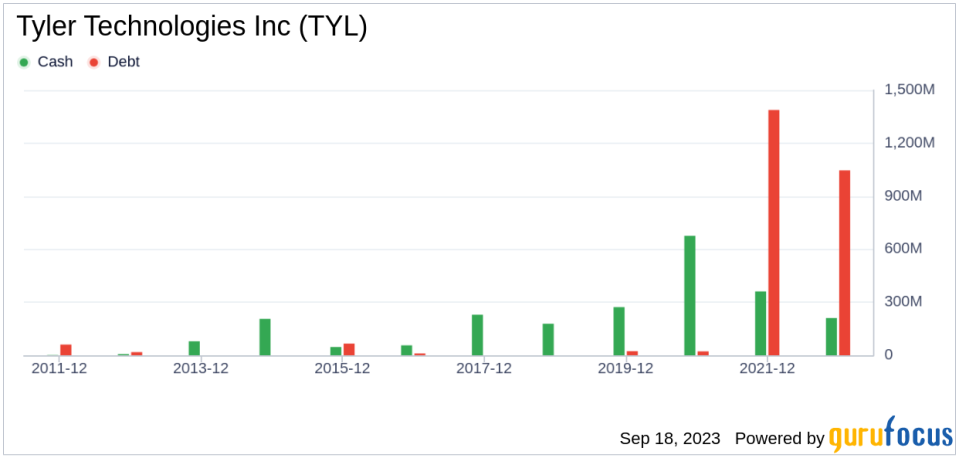
Companies with poor financial strength pose a high risk of permanent capital loss for investors. To avoid this, it's crucial to review a company's financial strength before purchasing shares. Key indicators of financial strength include the cash-to-debt ratio and interest coverage.
Tyler Technologies has a cash-to-debt ratio of 0.15, ranking worse than 88.82% of 2755 companies in the Software industry. Overall, Tyler Technologies' financial strength is rated 6 out of 10, indicating a fair financial condition.
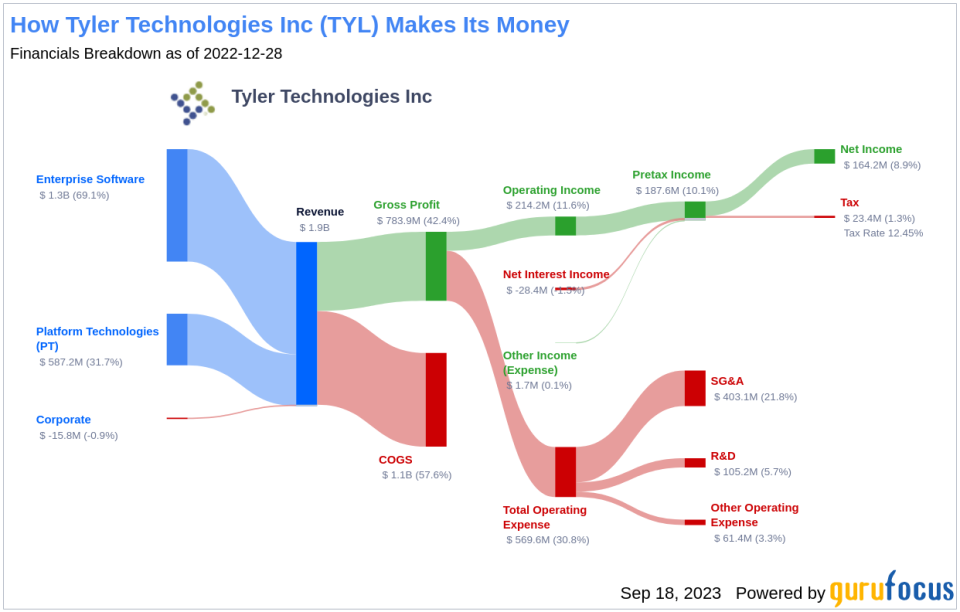
Profitability and Growth of Tyler Technologies
Companies that have consistently shown profitability over the long term offer less risk to investors. Tyler Technologies has been profitable for 10 out of the past 10 years. Over the past twelve months, the company had a revenue of $1.90 billion and an EPS of $3.87. Its operating margin is 10.96%, ranking better than 74.37% of 2747 companies in the Software industry. Overall, Tyler Technologies' profitability is ranked 9 out of 10, indicating strong profitability.
Growth is a crucial factor in a company's valuation. Tyler Technologies' 3-year average annual revenue growth is 17.2%, ranking better than 69.95% of 2413 companies in the Software industry. The 3-year average EBITDA growth rate is 15.4%, which ranks better than 61.01% of 2008 companies in the Software industry.
ROIC vs. WACC
Another way to assess a company's profitability is to compare its return on invested capital (ROIC) and the weighted average cost of capital (WACC). Tyler Technologies' ROIC is 4.33, and its WACC is 9.54 for the past 12 months.

Conclusion
In conclusion, Tyler Technologies' stock appears to be modestly undervalued. The company's financial condition is fair, and its profitability is strong. Its growth ranks better than 61.01% of 2008 companies in the Software industry. To learn more about Tyler Technologies' stock, you can check out its 30-Year Financials here.
To find high-quality companies that may deliver above-average returns, check out the GuruFocus High Quality Low Capex Screener.
This article first appeared on GuruFocus.
