Unveiling Vista Outdoor (VSTO)'s Value: Is It Really Priced Right? A Comprehensive Guide
Vista Outdoor Inc (NYSE:VSTO) recently experienced a daily loss of 18.08%, translating into a 3-month loss of 6.66%. Coupled with a Loss Per Share of $1.44, these figures raise a critical question: Is the stock modestly undervalued? This article offers a comprehensive valuation analysis, providing valuable insights for potential investors.
A Snapshot of Vista Outdoor Inc
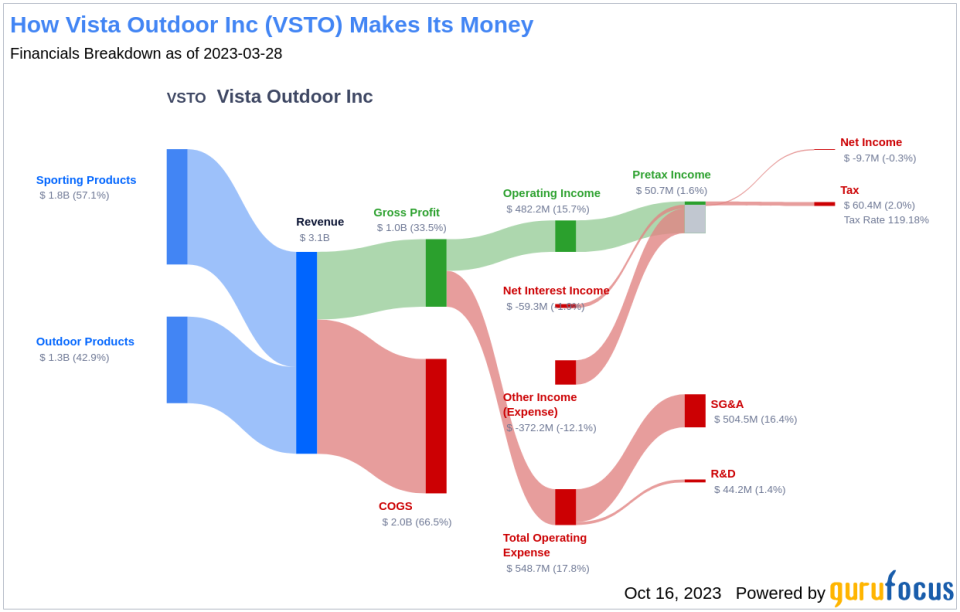
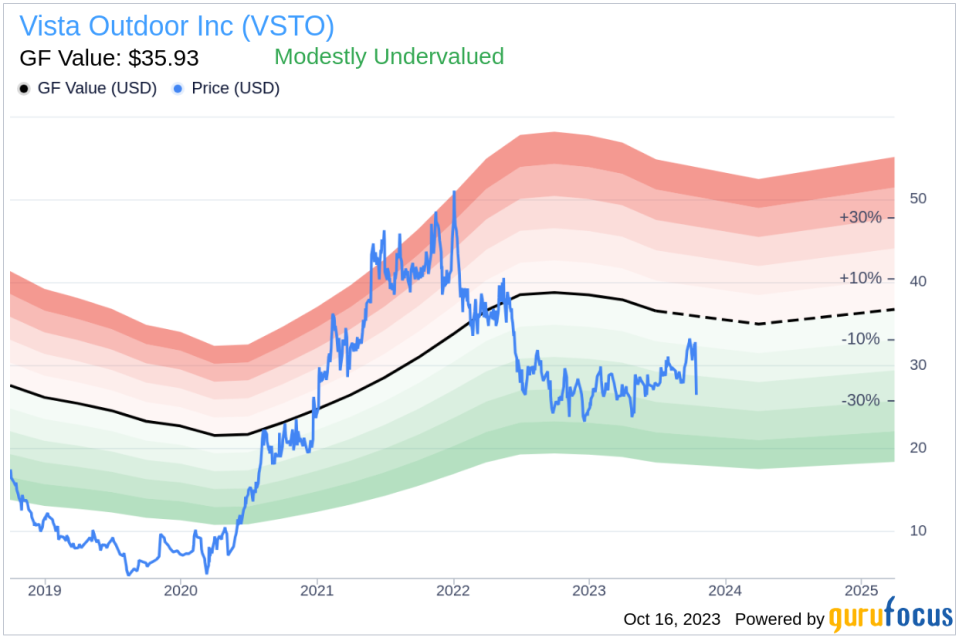
Vista Outdoor Inc designs, develops, and manufactures outdoor sports and recreation products, primarily in the United States. The company operates two segments: Shooting sports and Outdoor products. With a market cap of $1.60 billion, Vista Outdoor's stock price stands at $26.87, compared to its GF Value of $35.93. This discrepancy suggests that the stock may be modestly undervalued.
Understanding the GF Value
The GF Value is a proprietary measure of a stock's intrinsic value, calculated based on historical trading multiples, a GuruFocus adjustment factor, and future business performance estimates. If a stock price is significantly above the GF Value Line, it is considered overvalued, and its future return is likely to be poor. Conversely, if it is significantly below the GF Value Line, its future return will likely be higher.
Given Vista Outdoor's current price of $26.87 per share and a market cap of $1.60 billion, the stock appears to be modestly undervalued. This suggests that the long-term return of its stock is likely to be higher than its business growth.
Financial Strength of Vista Outdoor
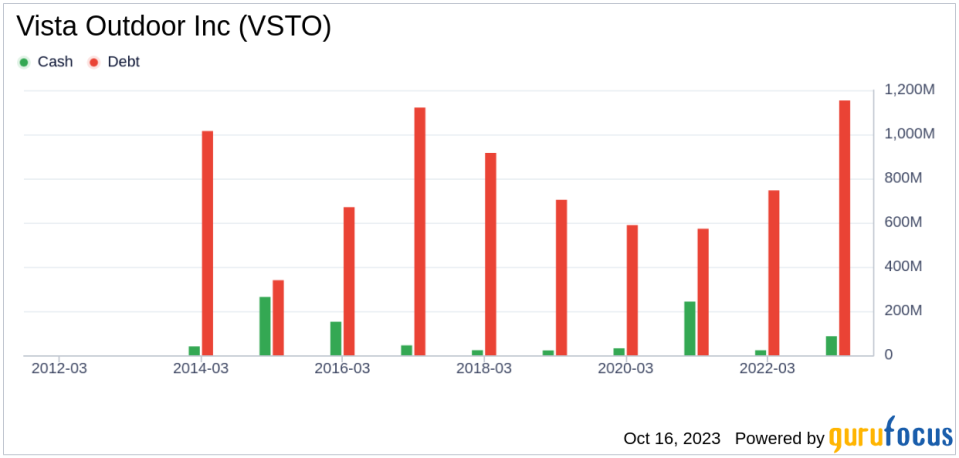
Investing in companies with low financial strength could result in permanent capital loss. Therefore, it's crucial to review a company's financial strength before deciding to buy shares. Vista Outdoor has a cash-to-debt ratio of 0.06, ranking worse than 86.1% of 813 companies in the Travel & Leisure industry. This suggests a fair balance sheet.
Profitability and Growth of Vista Outdoor
Investing in profitable companies carries less risk, especially in companies that have demonstrated consistent profitability over the long term. Vista Outdoor has been profitable 5 years over the past 10 years. During the past 12 months, the company had revenues of $3 billion and a Loss Per Share of $1.44. Its operating margin of 13.53% is better than 67.81% of 814 companies in the Travel & Leisure industry.
One of the most important factors in the valuation of a company is growth. Companies that grow faster create more value for shareholders, especially if that growth is profitable. The average annual revenue growth of Vista Outdoor is 21.5%, ranking better than 89.74% of 760 companies in the Travel & Leisure industry. However, the 3-year average EBITDA growth is 0%, ranking worse than 0% of 604 companies in the Travel & Leisure industry.
ROIC vs WACC
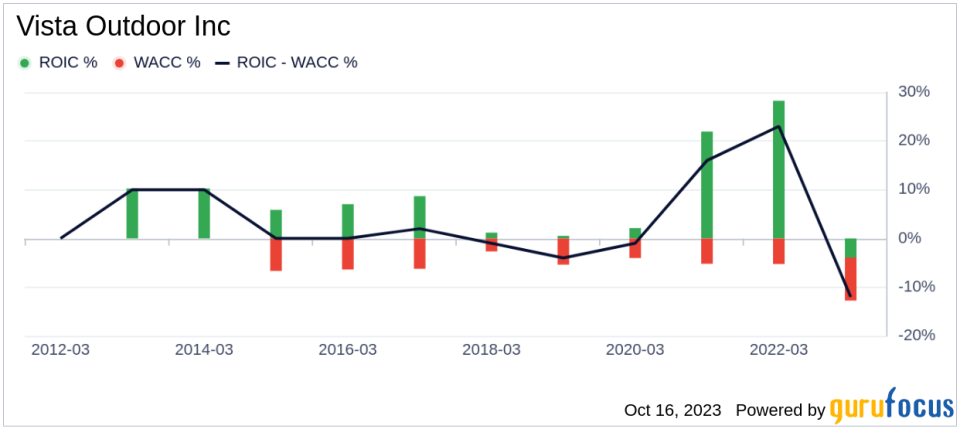
Comparing a company's return on invested capital (ROIC) to its weighted average cost of capital (WACC) can also evaluate a company's profitability. Vista Outdoor's ROIC is 29.19 while its WACC came in at 8.28.
Conclusion
In summary, the stock of Vista Outdoor appears to be modestly undervalued. The company's financial condition is fair, and its profitability is fair. However, its growth ranks worse than 0% of 604 companies in the Travel & Leisure industry. To learn more about Vista Outdoor stock, you can check out its 30-Year Financials here.
To find out the high-quality companies that may deliver above-average returns, please check out GuruFocus High Quality Low Capex Screener.
This article, generated by GuruFocus, is designed to provide general insights and is not tailored financial advice. Our commentary is rooted in historical data and analyst projections, utilizing an impartial methodology, and is not intended to serve as specific investment guidance. It does not formulate a recommendation to purchase or divest any stock and does not consider individual investment objectives or financial circumstances. Our objective is to deliver long-term, fundamental data-driven analysis. Be aware that our analysis might not incorporate the most recent, price-sensitive company announcements or qualitative information. GuruFocus holds no position in the stocks mentioned herein.
This article first appeared on GuruFocus.
