Unveiling Williams (WMB)'s Value: Is It Really Priced Right? A Comprehensive Guide
Williams Companies Inc (NYSE:WMB) has been making notable strides in the stock market, with a daily gain of 1.09% and a three-month gain of 3.65%. The company's Earnings Per Share (EPS) (EPS) stands at a robust 2.17. But does this performance make the stock fairly valued? This comprehensive analysis aims to answer that question and provide a detailed insight into Williams' valuation.
An Overview of Williams Companies Inc (NYSE:WMB)
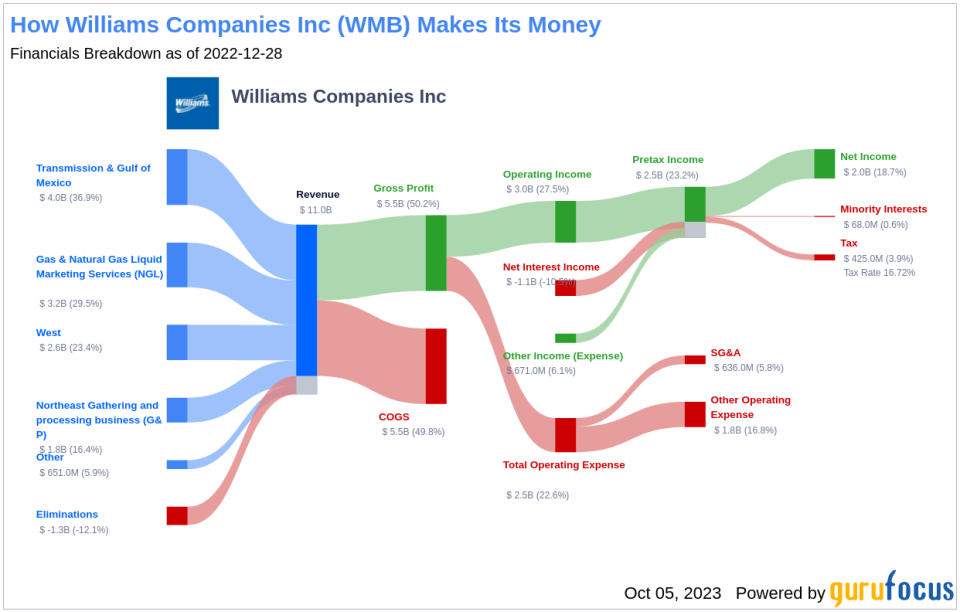
Williams is a prominent player in the midstream energy sector, owning and operating the extensive Transco and Northwest pipeline systems. The company also manages associated natural gas gathering, processing, and storage assets. In August 2018, Williams acquired the remaining 26% ownership of its limited partner, Williams Partners.
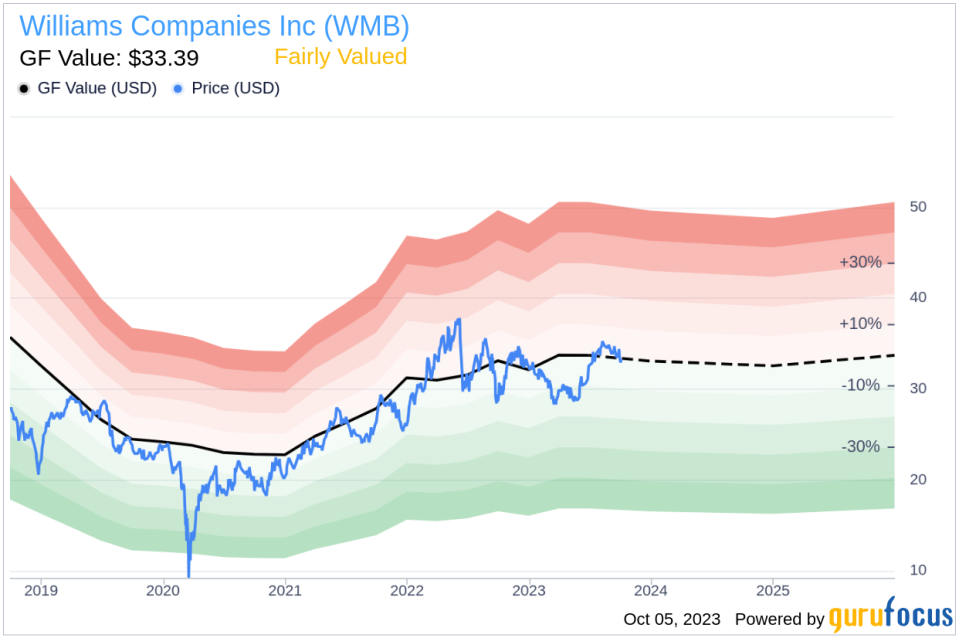
With its current share price at $33.29, Williams (NYSE:WMB) has a market cap of $40.50 billion. Its GF Value, a proprietary estimation of fair value, stands at $33.39. This close alignment suggests that the stock is fairly valued. The following analysis delves deeper into the company's value, intertwining essential company details with financial assessment.
Understanding the GF Value
The GF Value is a unique measure of a stock's intrinsic value, calculated based on historical trading multiples, a GuruFocus adjustment factor considering the company's past performance and growth, and future business performance estimates. The GF Value Line provides an overview of the fair trading value of the stock.
Williams (NYSE:WMB) appears to be fairly valued based on GuruFocus' valuation method. The GF Value suggests that if the stock's price is significantly above the GF Value Line, the stock may be overvalued and could yield poor future returns. Conversely, if the price is significantly below the GF Value Line, the stock may be undervalued, potentially leading to higher future returns.
Given that Williams is fairly valued, the long-term return of its stock is likely to align closely with the rate of its business growth.
Link: Explore companies that may deliver higher future returns at reduced risk.
Assessing Williams' Financial Strength
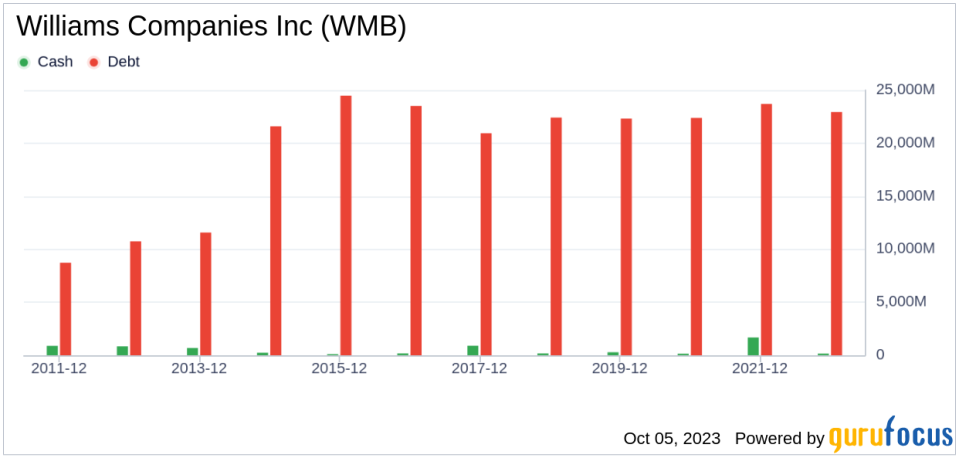
Before investing in a company, it's crucial to evaluate its financial strength. Companies with weak financial strength pose a higher risk of permanent loss. Key indicators such as the cash-to-debt ratio and interest coverage can provide valuable insights into a company's financial health. Williams' cash-to-debt ratio is 0.02, lagging behind 92.22% of 1028 companies in the Oil & Gas industry. This suggests that Williams' overall financial strength is poor, ranking 3 out of 10.
Profitability and Growth of Williams
Companies with consistent profitability over the long term typically offer less risk for investors. Higher profit margins often indicate a better investment compared to a company with lower profit margins. Williams has been profitable 7 times over the past 10 years. Over the past twelve months, the company generated a revenue of $11.50 billion and an EPS of $2.17. Its operating margin is 35.8%, ranking better than 79.41% of 981 companies in the Oil & Gas industry. Overall, Williams' profitability ranks 6 out of 10, indicating fair profitability.
Growth is a critical factor in a company's valuation. Faster growth, especially if profitable, is more likely to create value for shareholders. Williams' 3-year average annual revenue growth rate is 9.9%, which ranks lower than 50.52% of 859 companies in the Oil & Gas industry. The 3-year average EBITDA growth rate is 12.6%, ranking lower than 51.69% of 826 companies in the Oil & Gas industry.
Comparing ROIC and WACC
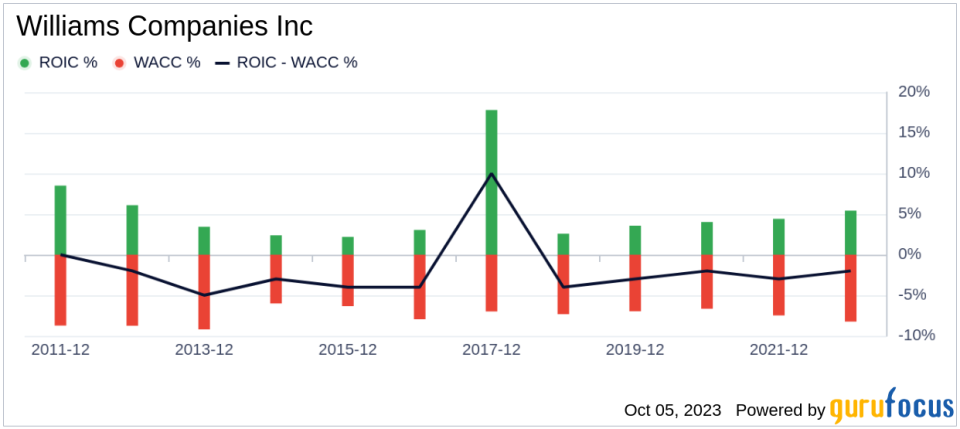
Comparing a company's return on invested capital (ROIC) to its weighted cost of capital (WACC) can provide insights into its profitability. The ROIC measures how well a company generates cash flow relative to the capital it has invested in its business. The WACC represents the rate a company is expected to pay on average to all its security holders to finance its assets. If the ROIC is higher than the WACC, it indicates that the company is creating value for shareholders. Over the past 12 months, Williams' ROIC was 6.83, while its WACC stood at 7.15.
Conclusion
In conclusion, the stock of Williams (NYSE:WMB) appears to be fairly valued. Despite its poor financial condition, the company's profitability is fair. However, its growth ranks lower than 51.69% of 826 companies in the Oil & Gas industry. For more information about Williams stock, you can check out its 30-Year Financials here.
To discover high-quality companies that may deliver above-average returns, check out the GuruFocus High Quality Low Capex Screener.
This article first appeared on GuruFocus.
