Unveiling WNS (Holdings) (WNS)'s Value: Is It Really Priced Right? A Comprehensive Guide
WNS (Holdings) Ltd (NYSE:WNS) has seen a daily gain of 2.93% and a 3-month loss of 6.1%. With an Earnings Per Share (EPS) of 2.67, the question arises - is this stock significantly undervalued? In this article, we will delve into the valuation analysis of WNS (Holdings) Ltd, providing a comprehensive evaluation of its market performance and intrinsic value. Read on to gain a deeper understanding of this company's financial standing.
Company Introduction
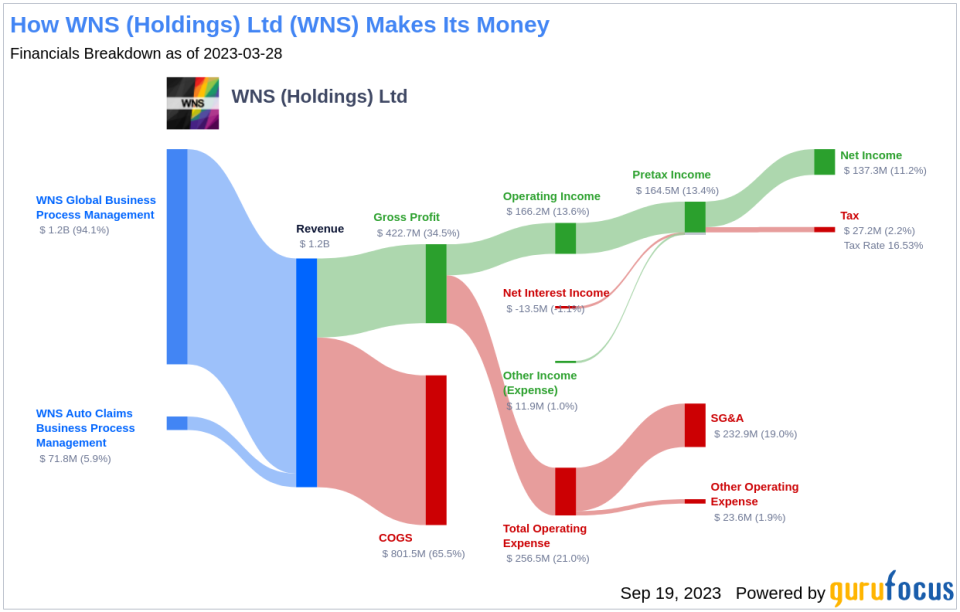
WNS (Holdings) Ltd is a global provider of business process management (BPM) services, offering comprehensive data, voice, analytical and business transformation services with a blended onshore, nearshore and offshore delivery model. The company has two reportable segments namely WNS Global BPM and WNS Auto Claims BPM. It generates maximum revenue from WNS Global BPM segment. Geographically, it derives a majority of revenue from the USA and also has a presence in the UK, Australia, Europe, South Africa and Rest of the world.
Understanding the GF Value
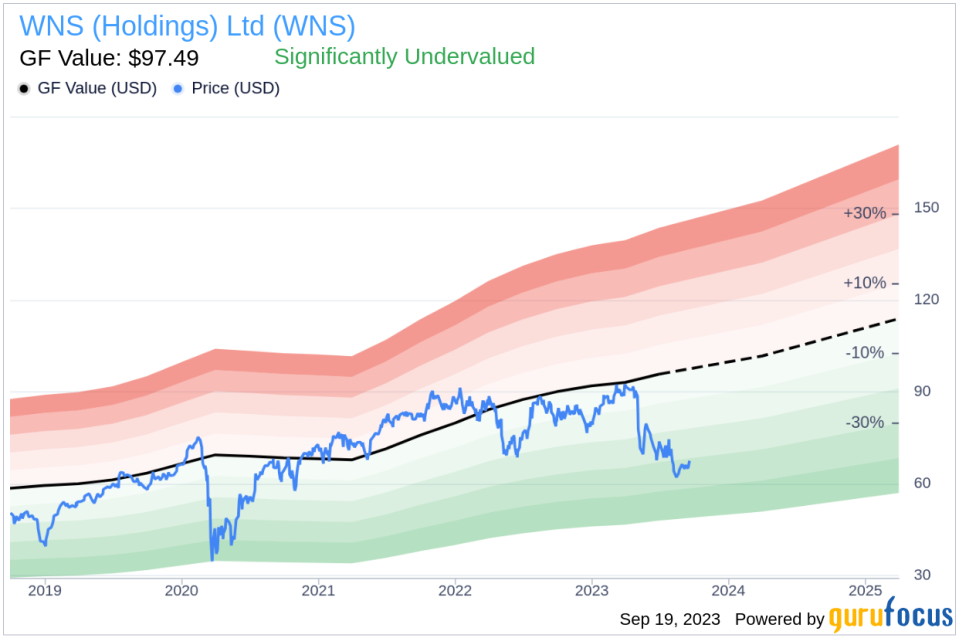
The GF Value is a proprietary measure of a stock's intrinsic value, computed considering historical trading multiples, a GuruFocus adjustment factor based on past performance and growth, and future business performance estimates. The GF Value Line denotes the stock's ideal fair trading value. If the stock price is significantly above the GF Value Line, it is overvalued and its future return is likely to be poor. On the other hand, if it is significantly below the GF Value Line, its future return will likely be higher.
As per our analysis, WNS (Holdings) Ltd's stock appears to be significantly undervalued. The current price of $67.42 per share and the market cap of $3.20 billion indicate that the stock is trading below its fair value. This suggests that the long-term return of its stock is likely to be much higher than its business growth.
Link: These companies may deliever higher future returns at reduced risk.
Assessing Financial Strength
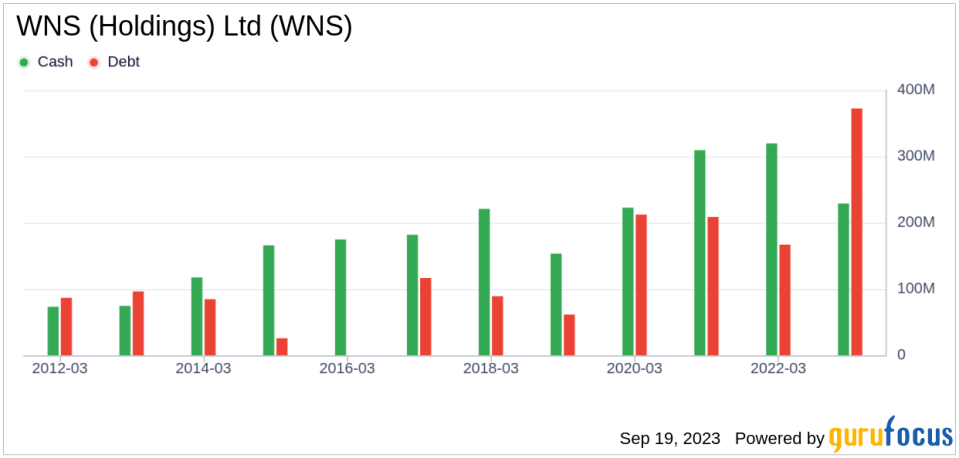
Before investing in a company, it's crucial to assess its financial strength. Companies with poor financial strength pose a higher risk of permanent loss. A great way to understand the financial strength of a company is by looking at the cash-to-debt ratio and interest coverage. WNS (Holdings) Ltd has a cash-to-debt ratio of 0.41, which is lower than 78.39% of 2753 companies in the Software industry. This indicates that the financial strength of WNS (Holdings) Ltd is fair.
Profitability and Growth
Investing in profitable companies carries less risk, especially those that have demonstrated consistent profitability over the long term. A company with high profit margins offers better performance potential than a company with low profit margins. WNS (Holdings) has been profitable for 10 years over the past 10 years. During the past 12 months, the company had revenues of $1.30 billion and Earnings Per Share (EPS) of $2.67. Its operating margin of 13.28% is better than 79.17% of 2751 companies in the Software industry. This indicates that WNS (Holdings)'s profitability is strong.
Growth is probably the most important factor in the valuation of a company. The faster a company is growing, the more likely it is to be creating value for shareholders, especially if the growth is profitable. The 3-year average annual revenue growth rate of WNS (Holdings) is10.5%, which ranks better than 56.34% of 2412 companies in the Software industry. However, the 3-year average EBITDA growth rate is 5.5%, which ranks worse than 56.6% of 2009 companies in the Software industry.
Return on Invested Capital vs Weighted Average Cost of Capital
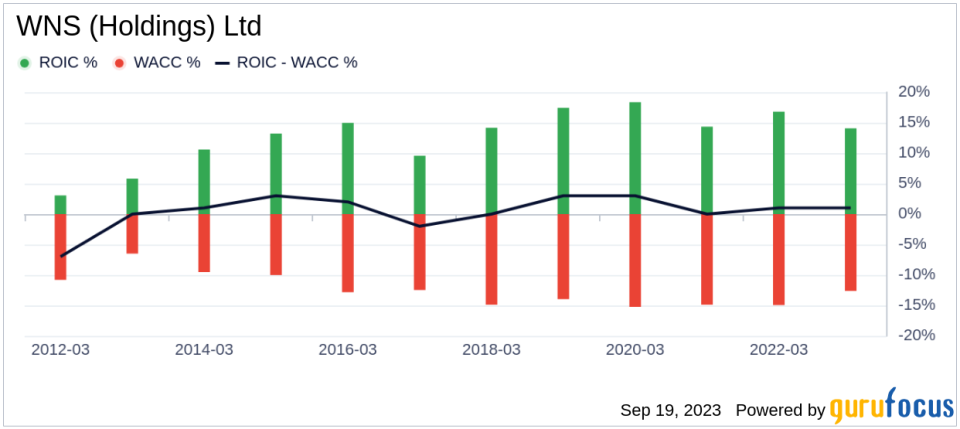
Return on invested capital (ROIC) measures how well a company generates cash flow relative to the capital it has invested in its business. The weighted average cost of capital (WACC) is the rate that a company is expected to pay on average to all its security holders to finance its assets. Ideally, the return on invested capital should be higher than the weighted cost of capital. For the past 12 months, WNS (Holdings)'s return on invested capital is 13.86, and its cost of capital is 11.63.
Conclusion
In summary, WNS (Holdings) Ltd's stock appears to be significantly undervalued. The company's financial condition is fair, and its profitability is strong. However, its growth ranks worse than 56.6% of 2009 companies in the Software industry. To learn more about WNS (Holdings) Ltd's stock, you can check out its 30-Year Financials here.
To find out the high quality companies that may deliver above average returns, please check out GuruFocus High Quality Low Capex Screener.
This article first appeared on GuruFocus.
