Unveiling XPO Inc (XPO)'s True Worth: Is It Really Priced Right?
XPO (NYSE:XPO) experienced a 1.61% daily gain and an impressive 26.78% 3-month gain. With an Earnings Per Share (EPS) (EPS) of 0.73, the question arises: is the stock significantly overvalued? This article aims to provide an in-depth valuation analysis of XPO Inc, integrating essential company details with financial assessment. Read on to unveil the true worth of XPO.
Company Overview
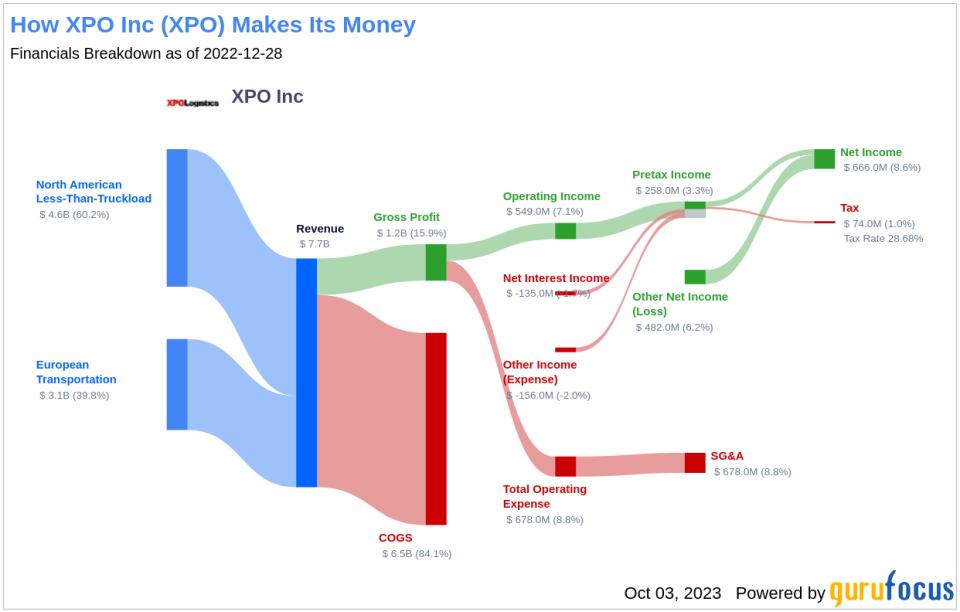
Following the spinoff of its contract logistics division (GXO) in 2021 and freight brokerage operations (RXO) in 2022, XPO is moving closer to becoming a pure-play asset-based less-than-truckload carrier. We estimate that LTL shipping now makes up 60% of total revenue, with XPO's European truckload and LTL operations accounting for the remaining 40%. However, XPO's LTL segment EBITDA mix is much higher than 60%. The firm intends to divest its European trucking division in the year ahead.
Here is the income breakdown of XPO:
Understanding the GF Value
The GF Value represents the current intrinsic value of a stock, derived from our exclusive method. The GF Value Line on our summary page gives an overview of the fair value that the stock should be traded at. It is calculated based on three factors:
Historical multiples (PE Ratio, PS Ratio, PB Ratio, and Price-to-Free-Cash-Flow) that the stock has traded at.
GuruFocus adjustment factor based on the company's past returns and growth.
Future estimates of the business performance.
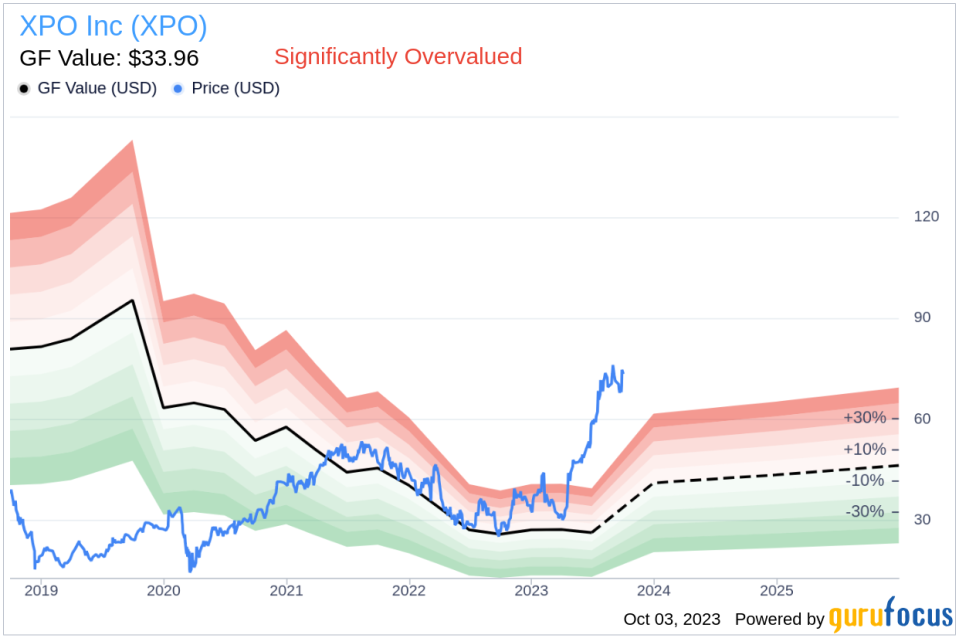
The GF Value Line is the fair value that the stock should be traded at. If the stock price is significantly above the GF Value Line, it is overvalued, and its future return is likely to be poor. Conversely, if it is significantly below the GF Value Line, its future return will likely be higher.
At its current price of $74.62 per share and the market cap of $8.70 billion, XPO stock appears to be significantly overvalued. Because XPO is significantly overvalued, the long-term return of its stock is likely to be much lower than its future business growth.
Link: These companies may deliver higher future returns at reduced risk.
Financial Strength
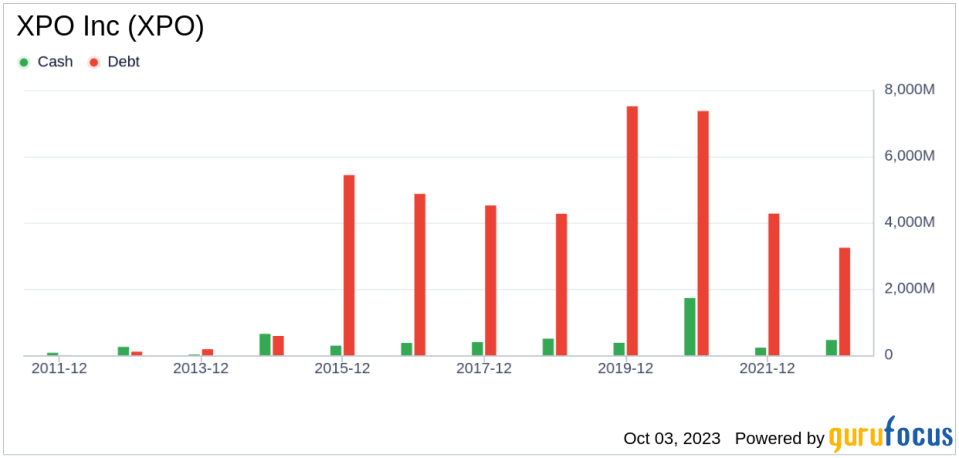
Investing in companies with low financial strength could result in permanent capital loss. Therefore, investors must carefully review a company's financial strength before deciding whether to buy shares. XPO has a cash-to-debt ratio of 0.09, which ranks worse than 85.12% of 934 companies in the Transportation industry. Based on this, GuruFocus ranks XPO's financial strength as 4 out of 10, suggesting a poor balance sheet.
This is the debt and cash of XPO over the past years:
Profitability and Growth
Companies that have been consistently profitable over the long term offer less risk for investors who may want to purchase shares. Higher profit margins usually dictate a better investment compared to a company with lower profit margins. XPO has been profitable 7 over the past 10 years. Over the past twelve months, the company had a revenue of $4.80 billion and Earnings Per Share (EPS) of $0.73. Its operating margin is 6.53%, which ranks worse than 56.19% of 945 companies in the Transportation industry. Overall, the profitability of XPO is ranked 5 out of 10, which indicates fair profitability.
One of the most important factors in the valuation of a company is growth. Long-term stock performance is closely correlated with growth according to GuruFocus research. Companies that grow faster create more value for shareholders, especially if that growth is profitable. The average annual revenue growth of XPO is -12.9%, which ranks worse than 85.48% of 909 companies in the Transportation industry. The 3-year average EBITDA growth is -11.5%, which ranks worse than 82.25% of 817 companies in the Transportation industry.
ROIC vs WACC
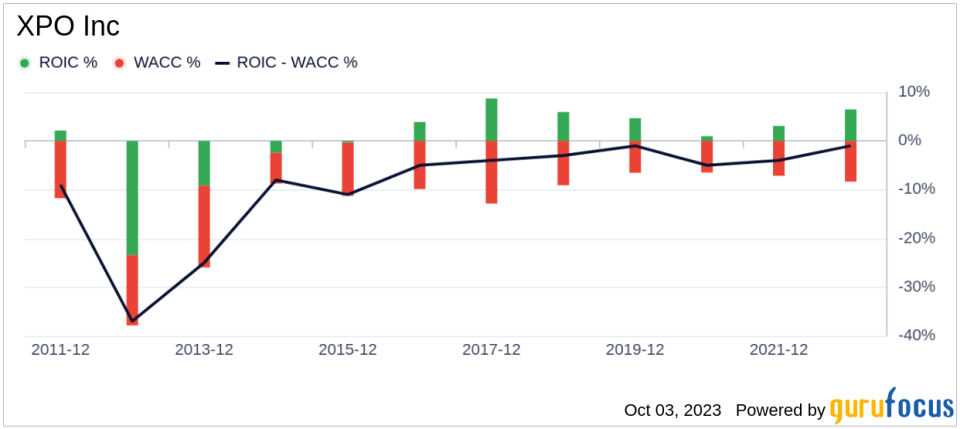
One can also evaluate a company's profitability by comparing its return on invested capital (ROIC) to its weighted average cost of capital (WACC). Return on invested capital (ROIC) measures how well a company generates cash flow relative to the capital it has invested in its business. The weighted average cost of capital (WACC) is the rate that a company is expected to pay on average to all its security holders to finance its assets. If the return on invested capital exceeds the weighted average cost of capital, the company is likely creating value for its shareholders. During the past 12 months, XPO's ROIC is 4.97 while its WACC came in at 12.61.
The historical ROIC vs WACC comparison of XPO is shown below:
Conclusion
Overall, XPO Inc (NYSE:XPO) stock appears to be significantly overvalued. The company's financial condition is poor, and its profitability is fair. Its growth ranks worse than 82.25% of 817 companies in the Transportation industry. To learn more about XPO stock, you can check out its 30-Year Financials here.
To find out the high-quality companies that may deliver above-average returns, please check out GuruFocus High Quality Low Capex Screener.
This article first appeared on GuruFocus.
