Unveiling XPO Inc (XPO)'s True Worth: A Comprehensive Guide on Its Market Value
Following a daily gain of 6.64% and a 3-month gain of 27.54%, XPO Inc (NYSE:XPO) has caught the attention of many investors. With an Earnings Per Share (EPS) of 0.73, the question arises: is XPO significantly overvalued? This article aims to answer this question through a comprehensive valuation analysis. We encourage you to read on to gain a deeper understanding of XPO's intrinsic value.
A Brief Introduction to XPO Inc (NYSE:XPO)
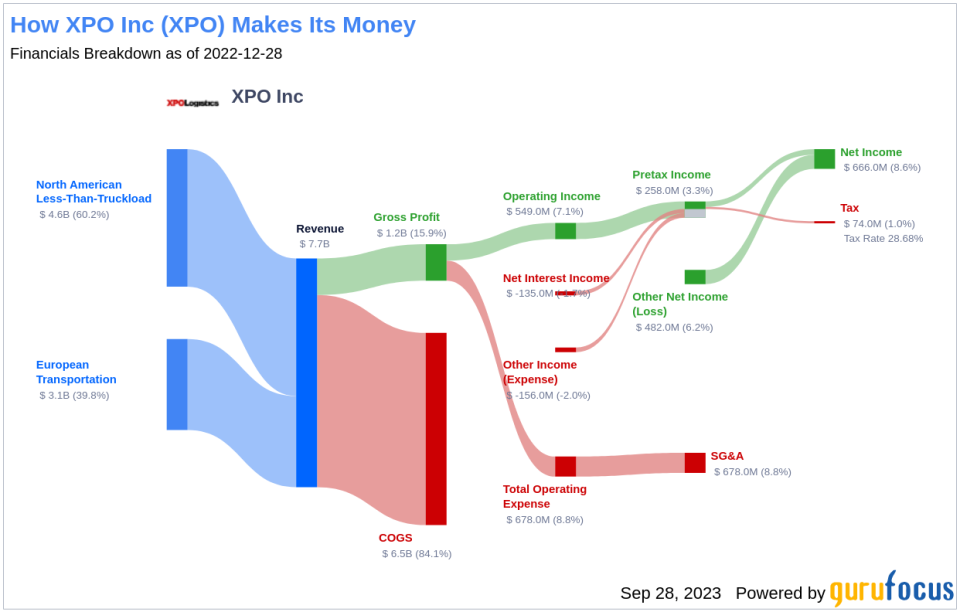
After spinning off its contract logistics division (GXO) in 2021 and freight brokerage operations (RXO) in 2022, XPO is transitioning towards becoming a pure-play asset-based less-than-truckload carrier. We estimate that LTL shipping now constitutes 60% of total revenue, with XPO's European truckload and LTL operations accounting for the remaining 40%. However, the LTL segment's EBITDA mix is significantly higher than 60%. XPO plans to divest its European trucking division in the upcoming year.
With a current stock price of $74.72, XPO (NYSE:XPO) has a market cap of $8.70 billion. This price will be compared with the GF Value, an estimation of the stock's fair value, to assess whether XPO is overvalued.
Understanding GF Value
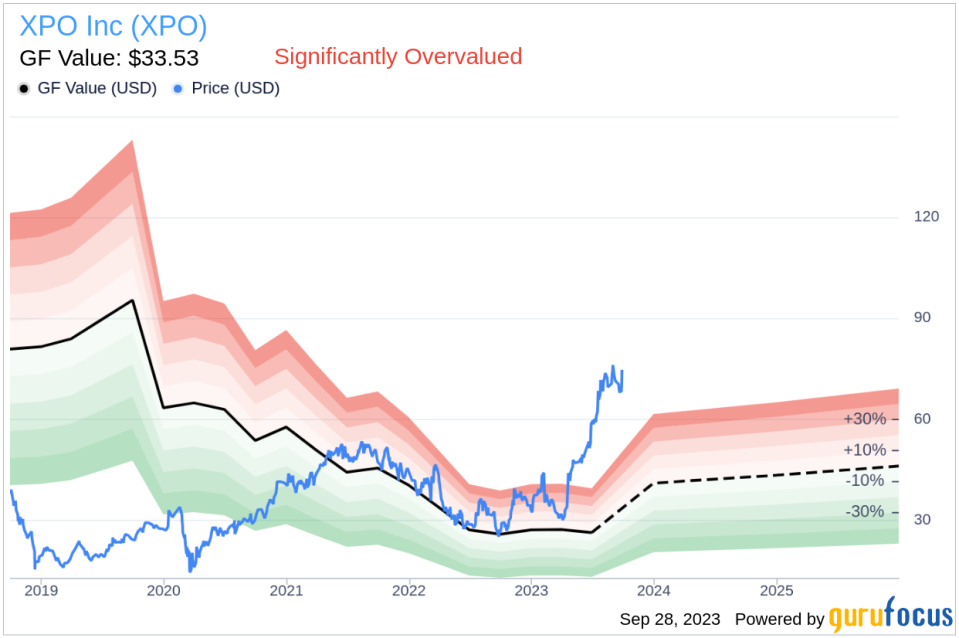
The GF Value is a unique measure of a stock's intrinsic value, based on three key factors: historical trading multiples, a GuruFocus adjustment factor reflecting past returns and growth, and future business performance estimates. The GF Value Line represents the fair trading value of the stock.
If the stock price is significantly above the GF Value Line, the stock is likely overvalued, and its future return may be poor. Conversely, if the stock price is significantly below the GF Value Line, the stock may be undervalued, and its future return could be high.
Currently, XPO (NYSE:XPO) appears to be significantly overvalued based on GuruFocus' valuation method. Given this overvaluation, the long-term return of XPO's stock is likely to be much lower than its future business growth.
Link: These companies may deliver higher future returns at reduced risk.
Financial Strength
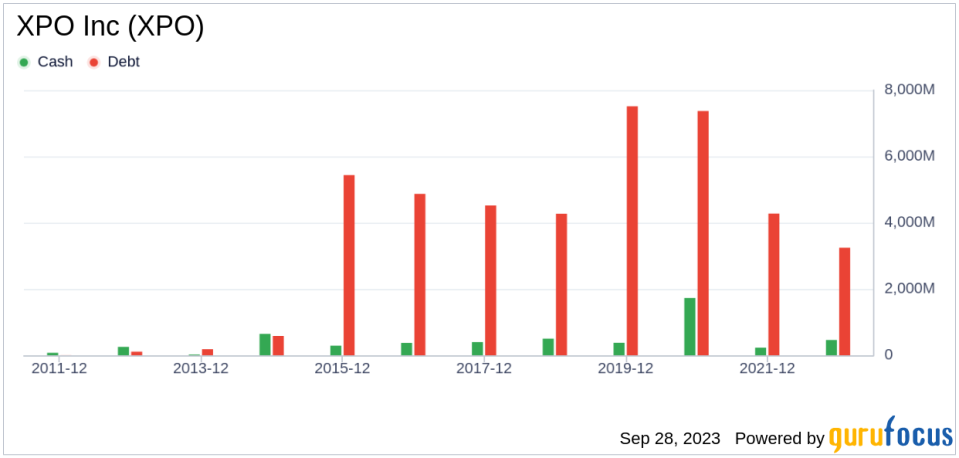
Investing in companies with poor financial strength carries a higher risk of permanent capital loss. Therefore, it is crucial to carefully review a company's financial strength before deciding to buy its stock. A good starting point is to examine the company's cash-to-debt ratio and interest coverage. XPO has a cash-to-debt ratio of 0.09, which ranks worse than 84.89% of 940 companies in the Transportation industry. GuruFocus ranks XPO's overall financial strength at 4 out of 10, indicating that it is poor.
Profitability
Investing in profitable companies carries less risk, especially those demonstrating consistent profitability over the long term. Typically, companies with high profit margins offer better performance potential than those with low profit margins. XPO has been profitable for 7 out of the past 10 years. Over the past 12 months, the company generated revenues of $4.80 billion and Earnings Per Share (EPS) of $0.73. Its operating margin of 6.53% is worse than 56.2% of 952 companies in the Transportation industry. Overall, GuruFocus ranks XPO's profitability as fair.
Growth
Growth is a crucial factor in a company's valuation. The faster a company is growing, the more likely it is to be creating value for shareholders, especially if the growth is profitable. XPO's 3-year average annual revenue growth rate is -12.9%, ranking worse than 85.48% of 916 companies in the Transportation industry. Its 3-year average EBITDA growth rate is -11.5%, which ranks worse than 82.22% of 821 companies in the Transportation industry.
ROIC vs WACC
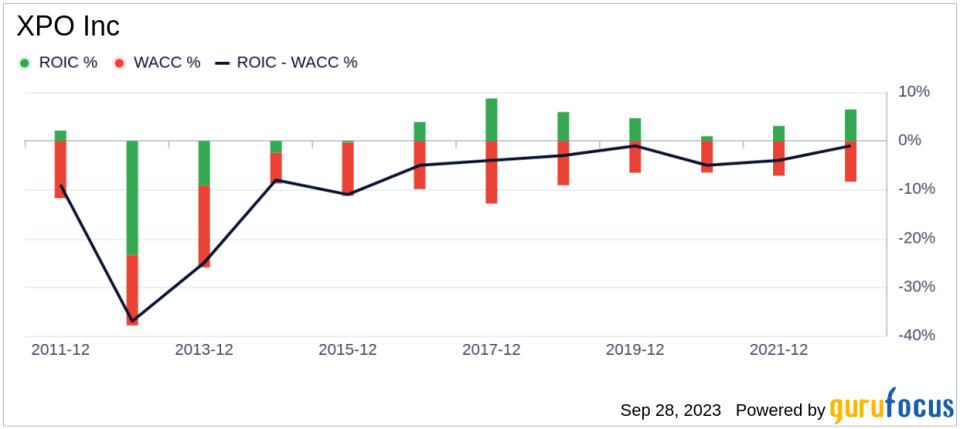
Another way to determine a company's profitability is to compare its Return on Invested Capital (ROIC) with its Weighted Average Cost of Capital (WACC). ROIC measures how well a company generates cash flow relative to the capital it has invested in its business. WACC is the rate that a company is expected to pay on average to all its security holders to finance its assets. When the ROIC is higher than the WACC, the company is likely creating value for shareholders. For the past 12 months, XPO's ROIC is 4.97, and its WACC is 12.41.
Conclusion
In conclusion, XPO Inc (NYSE:XPO) appears to be significantly overvalued. The company's financial condition is poor, and its profitability is fair. Its growth ranks worse than 82.22% of 821 companies in the Transportation industry. To learn more about XPO stock, you can check out its 30-Year Financials here.
To find high-quality companies that may deliver above-average returns, please check out the GuruFocus High Quality Low Capex Screener.
This article first appeared on GuruFocus.
