Unveiling Xylem's True Worth: Is It Really Priced Right? A Comprehensive Guide
Xylem Inc (NYSE:XYL) has been experiencing a slight downturn, with a daily loss of 4.84% and a 3-month loss of 6.7%. Despite this, the company posted an Earnings Per Share (EPS) of 1.88. This raises the question: is Xylem (NYSE:XYL) modestly undervalued? In this article, we will delve into the company's valuation, financial strength, profitability, and growth to provide a comprehensive analysis for potential investors.
Company Overview
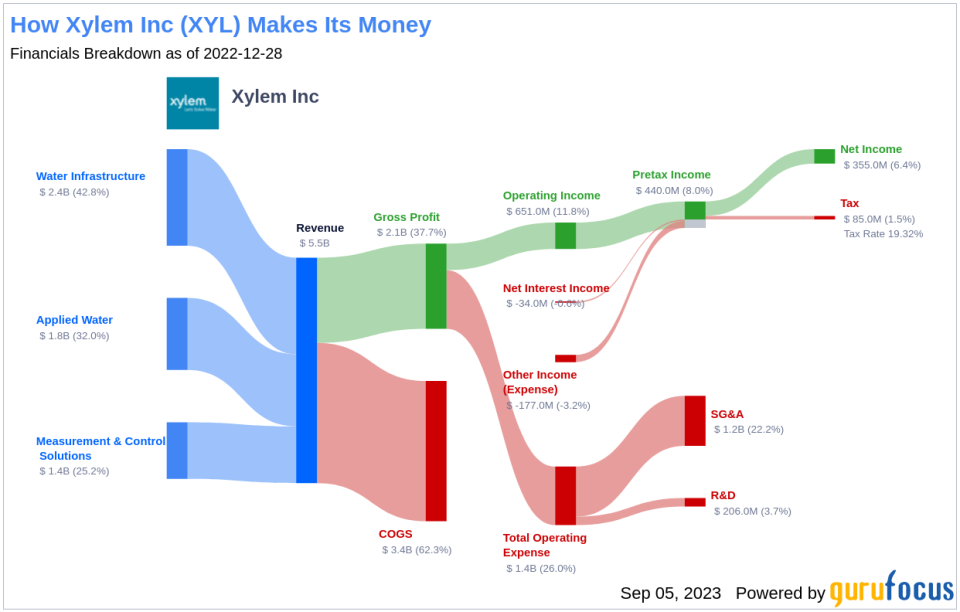
Xylem, a global leader in water technology, offers a wide range of solutions, including the transport, treatment, testing, and efficient use of water for customers in the utility, industrial, commercial, and residential sectors. Spun off from ITT in 2011, Xylem has a presence in over 150 countries and employs 16,200. The company generated $5.5 billion in revenue and $672 million in adjusted operating income in 2022. With a current stock price of $97.61 per share, Xylem has a market cap of $23.50 billion.
Understanding the GF Value
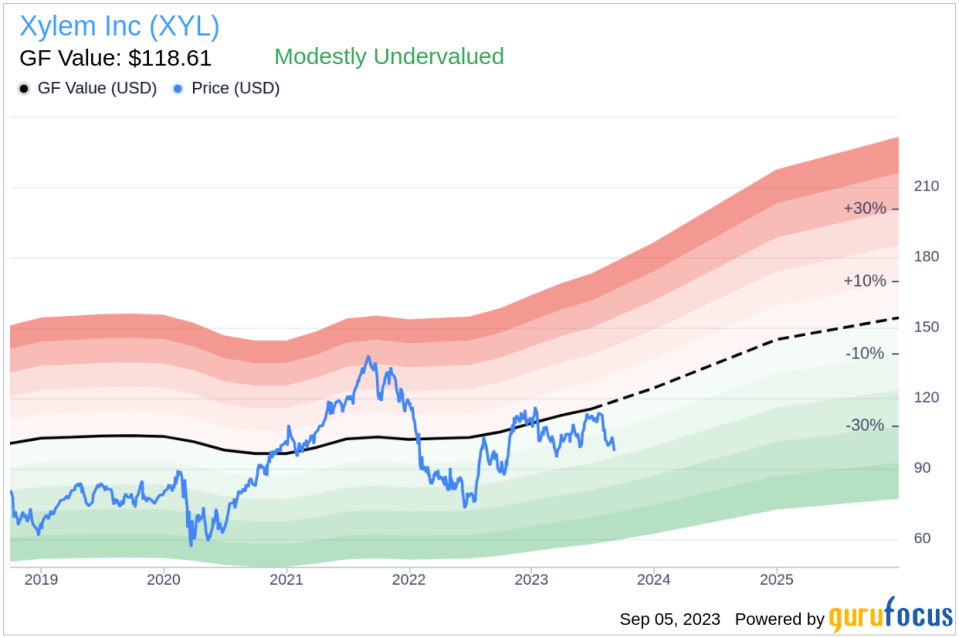
The GF Value is a proprietary measure that estimates the current intrinsic value of a stock. It is based on historical trading multiples, an adjustment factor from GuruFocus based on the company's past performance and growth, and future business performance estimates. The GF Value Line on our summary page provides an overview of the fair value at which the stock should be traded.
Based on this method, Xylem (NYSE:XYL) appears to be modestly undervalued. If the stock price is significantly above the GF Value Line, the stock may be overvalued, predicting poor future returns. Conversely, if the stock price is significantly below the GF Value Line, the stock may be undervalued, suggesting high future returns. Given Xylem's current price and market cap, the stock appears to be modestly undervalued, implying that the long-term return of its stock is likely to be higher than its business growth.
Link: These companies may deliver higher future returns at reduced risk.
Financial Strength
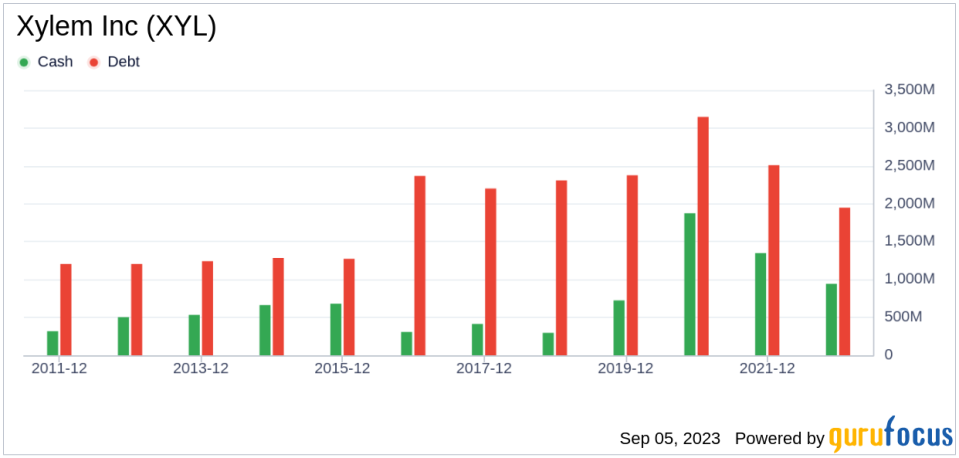
Investing in companies with low financial strength could result in permanent capital loss. A company's financial strength can be initially assessed by looking at the cash-to-debt ratio and interest coverage. Xylem has a cash-to-debt ratio of 0.27, which ranks worse than 79.83% of 2791 companies in the Industrial Products industry. Based on this, GuruFocus ranks Xylem's financial strength as 7 out of 10, suggesting a fair balance sheet.
Profitability and Growth
Investing in profitable companies carries less risk, especially if the companies have demonstrated consistent profitability over the long term. Xylem has been profitable 10 years over the past 10 years. During the past 12 months, the company had revenues of $6.10 billion and Earnings Per Share (EPS) of $1.88. Its operating margin of 11.11% is better than 71.51% of 2801 companies in the Industrial Products industry. Overall, GuruFocus ranks Xylem's profitability as fair.
Growth is probably the most important factor in the valuation of a company. A faster-growing company creates more value for shareholders, especially if the growth is profitable. The 3-year average annual revenue growth of Xylem is 1.7%, which ranks worse than 67.34% of 2670 companies in the Industrial Products industry. The 3-year average EBITDA growth rate is -0.6%, which ranks worse than 69.22% of 2362 companies in the Industrial Products industry.
ROIC vs WACC
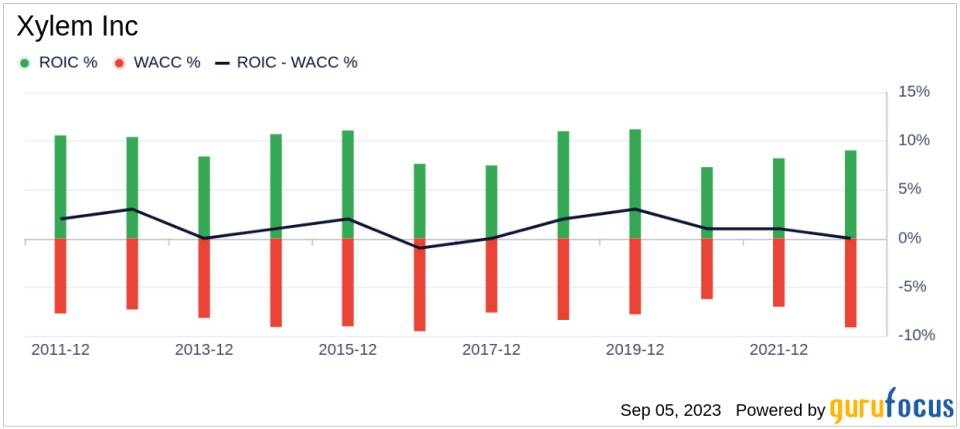
One can also evaluate a company's profitability by comparing its return on invested capital (ROIC) to its weighted average cost of capital (WACC). Return on invested capital (ROIC) measures how well a company generates cash flow relative to the capital it has invested in its business. The weighted average cost of capital (WACC) is the rate that a company is expected to pay on average to all its security holders to finance its assets. If the return on invested capital exceeds the weighted average cost of capital, the company is likely creating value for its shareholders. During the past 12 months, Xylem's ROIC is 7.14 while its WACC came in at 9.66.
Conclusion
In conclusion, the stock of Xylem (NYSE:XYL) appears to be modestly undervalued. The company's financial condition is fair and its profitability is fair. Its growth ranks worse than 69.22% of 2362 companies in the Industrial Products industry. To learn more about Xylem stock, you can check out its 30-Year Financials here.
To find out the high-quality companies that may deliver above-average returns, please check out GuruFocus High Quality Low Capex Screener.
This article first appeared on GuruFocus.
