Unveiling YETI Holdings (YETI)'s Value: Is It Really Priced Right? A Comprehensive Guide
YETI Holdings Inc (NYSE:YETI) experienced a daily loss of 6.19%, with a three-month gain of 13.95%. Its Earnings Per Share (EPS) stands at 0.76. The question we aim to answer is: is YETI Holdings significantly undervalued? This comprehensive analysis will delve into the company's valuation, financial strength, and growth potential, providing valuable insights for potential investors.
A Snapshot of YETI Holdings Inc (NYSE:YETI)
YETI Holdings is a leading designer, marketer, and distributor of premium products for the outdoor and recreation market, sold under the YETI brand. The company's diverse product portfolio includes coolers and equipment, drinkware, and other accessories. With a current stock price of $41.53 and a market cap of $3.60 billion, we aim to compare this with the GF Value, our estimate of the stock's fair value.

Breaking Down the GF Value
The GF Value is our proprietary measure of a stock's intrinsic value, calculated based on historical trading multiples, a GuruFocus adjustment factor based on past performance and growth, and future business performance estimates. The GF Value Line on our summary page provides a snapshot of the fair value at which the stock should ideally be traded.
Our analysis suggests that YETI Holdings (NYSE:YETI) is significantly undervalued. The GF Value Line indicates that the stock should be traded at a higher value. If the stock price is significantly below the GF Value Line, its future return will likely be higher. Given that YETI Holdings is significantly undervalued, the long-term return of its stock is likely to exceed its business growth.

Assessing Financial Strength
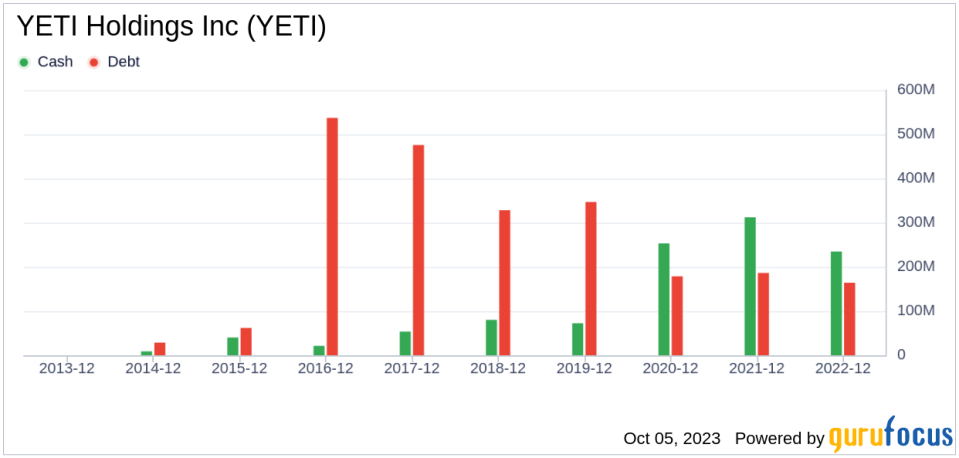
Investing in companies with low financial strength could result in permanent capital loss. It's essential to review a company's financial strength before deciding to buy shares. YETI Holdings has a cash-to-debt ratio of 1.43, ranking better than 65.06% of 810 companies in the Travel & Leisure industry. This suggests a strong balance sheet.
Profitability and Growth
Investing in profitable companies carries less risk. YETI Holdings has been profitable 10 years over the past 10 years, with revenues of $1.60 billion and Earnings Per Share (EPS) of $0.76 in the past 12 months. Its 3-year average revenue growth rate is better than 88.67% of 759 companies in the Travel & Leisure industry. YETI Holdings's 3-year average EBITDA growth rate is 10.4%, ranking better than 58.31% of 602 companies in the Travel & Leisure industry.
ROIC vs WACC
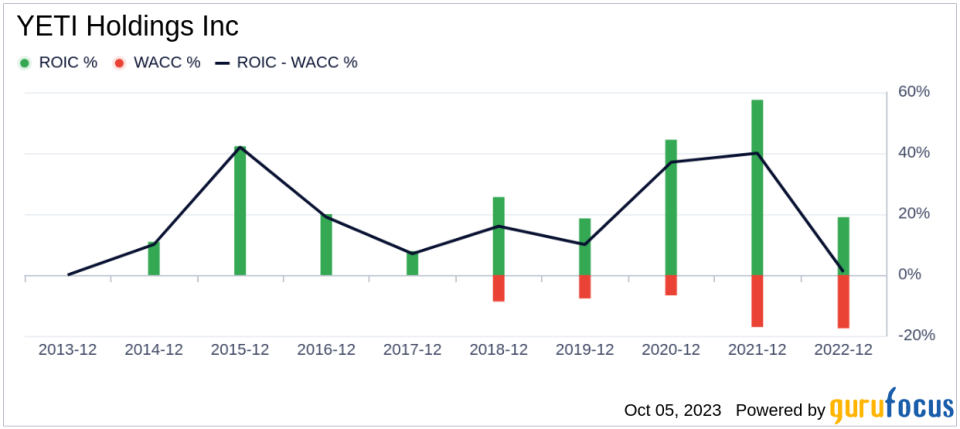
Comparing a company's return on invested capital to the weighted average cost of capital can help determine its profitability. Return on invested capital (ROIC) measures how well a company generates cash flow relative to the capital it has invested in its business. The weighted average cost of capital (WACC) is the rate that a company is expected to pay on average to all its security holders to finance its assets. For the past 12 months, YETI Holdings's return on invested capital is 11.4, and its cost of capital is 16.65.
Conclusion
In summary, YETI Holdings (NYSE:YETI) is significantly undervalued. The company has strong financial health and profitability, with growth better than 58.31% of 602 companies in the Travel & Leisure industry. To learn more about YETI Holdings stock, you can check out its 30-Year Financials here.
To find out the high quality companies that may deliver above-average returns, please check out GuruFocus High Quality Low Capex Screener.
This article first appeared on GuruFocus.
