US container imports still rising, topping pre-COVID levels

There has been no shortage of doom and gloom about the “plunge” in U.S. imports this year. And yet, the numbers still don’t show anything to be particularly gloomy about.
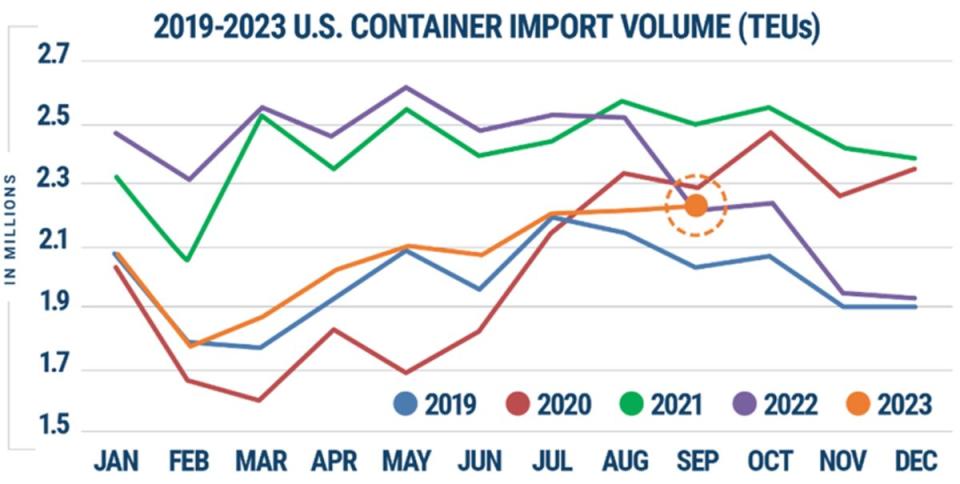
U.S. imports have been rising month on month since February. They were up sequentially yet again in September, according to data released Tuesday by Descartes Systems Group (NASDAQ: DSGX).
Descartes said the U.S. imported 2,203,452 twenty-foot equivalent units in September. That’s up 0.3% versus August and up 27% from the low point in February amid Chinese New Year.
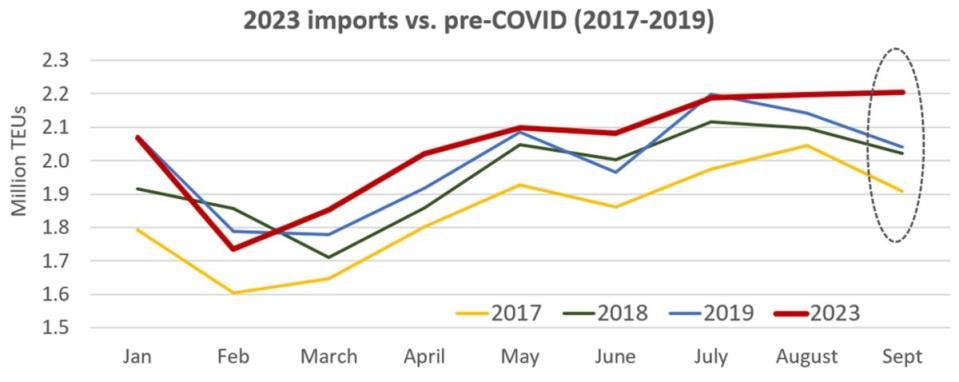
U.S. imports over the first nine months of 2023 were 2.5% higher than in the same period in 2019, pre-COVID, according to Descartes’ data. They were up 4.6% compared to the same period in 2018 and 11.4% versus January-September 2017.
This September’s imports significantly exceeded pre-pandemic levels: up 8% from the same month in 2019, 9% from 2018 and 15.5% from 2017. Normally, volumes decline in September compared to August. This year, they held firm.
Indeed, this year’s import numbers only look bad if you compare them to inflated levels seen during the one-off COVID-era shipping boom of 2021-2022. Negative sentiment based on such comparisons may stem from recency bias: the tendency to overemphasize the importance of recent events when estimating future events.
Imports from China building back up
According to Descartes’ data, which is based on customs filings, September saw significant month-on-month import losses at ports in Los Angeles and New York/New Jersey, offset by significant sequential gains in Long Beach, California, and Tacoma, Washington.
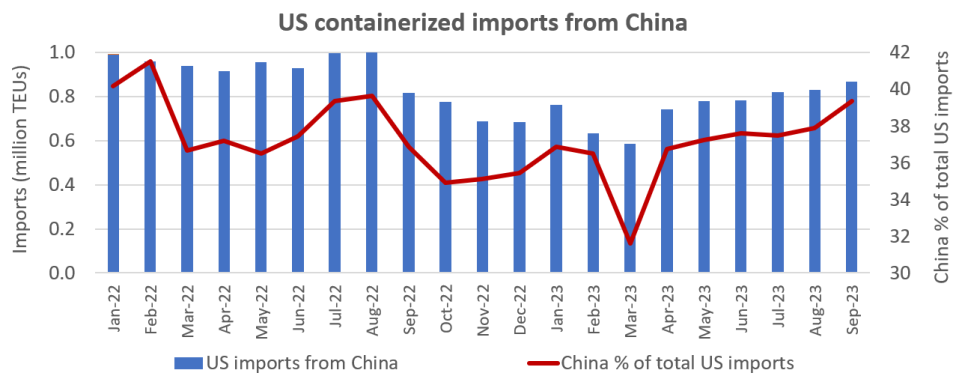
Inbound volumes from China continued to be the primary driver of sequential growth — despite all the talk of nearshoring and supply chain diversification.
U.S. imports from China — at 866,762 TEUs — accounted for 39.3% of total imports in September and were up 4.2% versus August. September imports from China were the highest since August 2022, according to Descartes’ data.
NRF slightly reduces full-year forecast
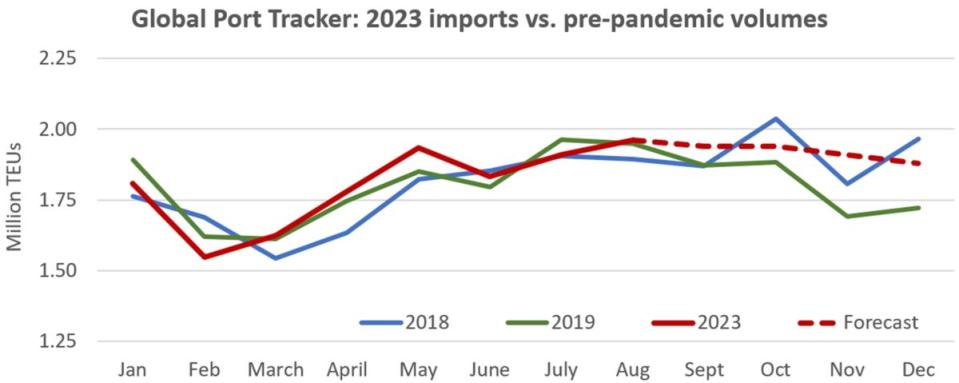
Another data source, Global Port Tracker, published by the National Retail Federation (NRF) and consultancy Hackett Associates, measures imports to 12 leading U.S. ports using official numbers released by the ports.
It released its latest monthly outlook on Tuesday. “Cargo volumes will still be strong the rest of the year, but not as high as we expected a month ago,” said Jonathan Gold, the the NRF’s vice president for supply chain and customs policy.
“Retailers stocked up early this year as a safeguard against supply chain labor issues and are well-situated to meet consumer demand.”
The NRF and Port Tracker previously predicted full-year imports for the ports it covers of 22.3 million TEUs. On Tuesday, it pared that forecast slightly, to 22.1 million TEUs — still up 1.5% and 2.3% from the pre-COVID years of 2018 and 2019, respectively.
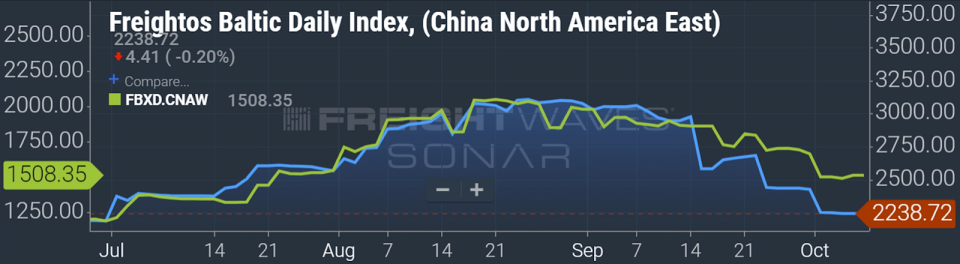
Asia-US spot rates have retreated
Declining trans-Pacific spot rates likely signal that volumes will weaken in the fourth quarter, as predicted by the NRF and as they would seasonally in any normal, nonpandemic year.
Spot rates logged double-digit gains between late June and mid-August (albeit off very low levels), giving container lines hope that post-boom returns might be less painful than expected. That hope faded as spot rates retreated. Spot rates sank in late August and throughout September before stabilizing at lower levels in October.
The Freightos Baltic Daily Index (FBX) assessed China-East Coast spot rates at $2,239 per forty-foot equivalent unit on Friday, down 24% from Aug. 17 and up only 2% from June 30.
The West Coast lane has fared better. FBX’s China-West Coast index was at $1,508 per FEU on Friday, down 17% from Aug. 17 but still up 26% versus June 30.
Click for more articles by Greg Miller
Related articles:
Container shipping has a Europe problem and it’s getting worse
Trouble ahead: Container shipping rates sinking further into the red
US container imports rise in line with pre-COVID peak season pattern
Rebound in trans-Pacific container shipping rates has stalled
Asia-US spot rates top contract rates for first time since 2022
Maersk hikes 2023 guidance but warns of ‘years’ of challenges
‘Colossal’ tidal wave of new container ships about to strike
The post US container imports still rising, topping pre-COVID levels appeared first on FreightWaves.
