US imports dragged down by seasonality, Panama Canal crisis
The good news for container lines: U.S. imports are still higher than they were before the pandemic. The bad news: This year’s string of month-on-month gains is over. Seasonality, combined with worsening conditions at the Panama Canal, pulled down imports in November — a negative for freight rates.
According to data from Descartes (NASDAQ: DSGX) released Thursday, U.S. ports handled 2,099,408 twenty-foot equivalent units of imports last month, 9% less than in October.
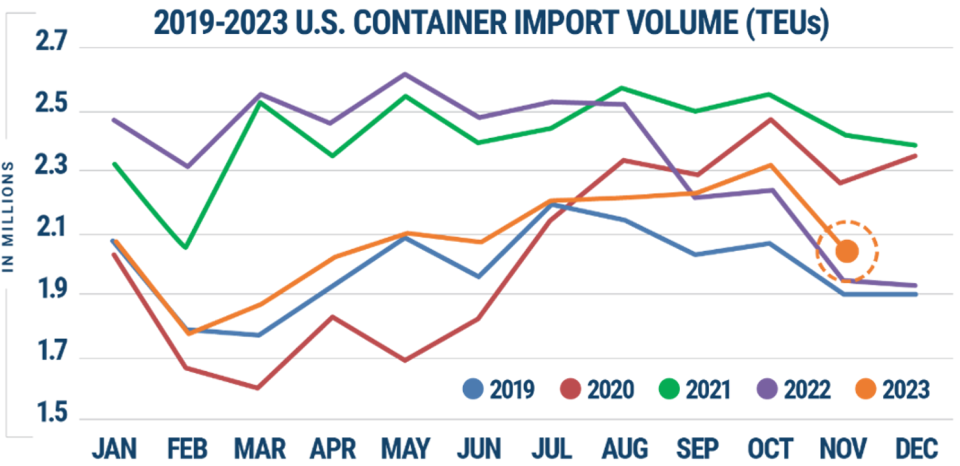
Volumes were up 7.4% versus last November, but this was a case of easy “comps.” In November 2022, volumes were in mid-crash due to bloated inventories amassed at the tail end of the supply chain crisis.
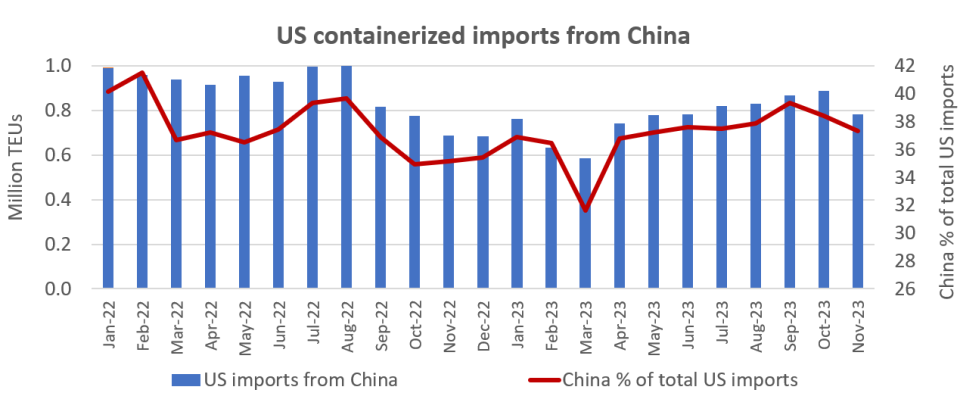
China has been the main volume driver this year, both on the way up and down. The American and Chinese economies remain intimately intertwined, regardless of geopolitical tensions and rhetoric on diversifying supply chains.
U.S. imports from China totaled 783,467 TEUs in November, down 11.7% from October, according to Descartes. The reduction in imports from China accounted for half of last month’s countrywide month-on-month decline, but even so, Chinese cargo accounted for 37.3% of total volumes.
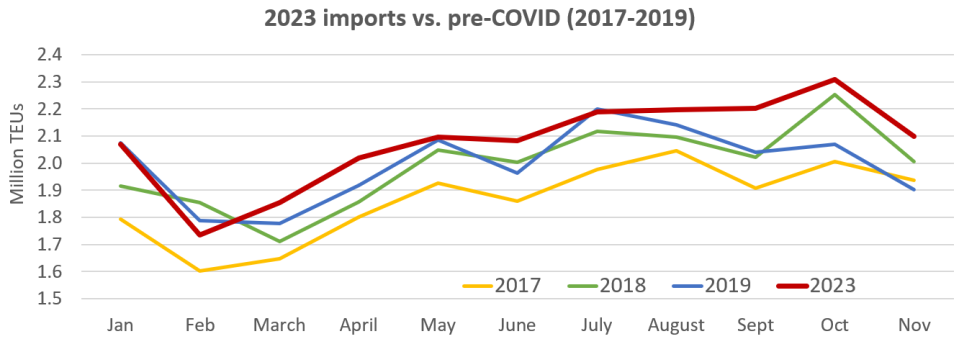
Imports continue to outpace pre-COVID levels
Import volumes, while declining sequentially, are still outpacing pre-COVID levels.
Imports from January-November were up 4% versus the same period in 2019, 4.4% versus 2018 and 11.4% versus 2017, according to Descartes’ data.
This November’s imports were up 10.4% from the same month in 2019, 4.7% from November 2018 and 8.4% from November 2017.
West Coast regains more market share
Meanwhile, the positive reversal of fortunes for West Coast ports continues.
West Coast ports lost market share to East and Gulf Coast ports earlier this year due to concerns over a labor dispute between the West Coast dockworkers’ union and terminal employers.
A new six-year labor contract was agreed to in June, removing the West Coast labor threat, while concerns on East and Gulf Coast services have escalated due to low water levels in the Panama Canal — all of which is helping West Coast ports regain market share.
The top five West Coast ports accounted for 43.1% of total imports last month, while the top five East and Gulf Coast ports accounted for 42%. (Smaller ports accounted for the remaining 14.9%.)
In contrast, the October ratio was 45.1% for top East and Gulf Coast ports versus 39.6% for the top West Coast ports.
The shift in market share was due to a drop in volumes to East and Gulf Coast ports in November.
Descartes’ data, which is based on customs filings, showed sizable month-on-month declines in New York/New Jersey (down 62,062 TEUs or 16.1% versus October), Houston (down 46,857 TEUs or 26.7%) and Charleston, South Carolina (down 22,632 TEUs or 18.7%).
According to Chris Jones, Descartes’ executive vice president of industry and services, “The Panama drought finally appears to be impacting U.S. container import volume at East and Gulf Coast ports, which could worsen with the Panama Canal Authority’s plans to further reduce the number of daily transit slots in coming months.”
As evidence of Panama Canal fallout, Jones pointed to the steep decline in Gulf Coast port volumes in November. It was the largest sequential drop for these ports this year, by far, at over double the pace of the countrywide decline.
More pressure on spot rates
Ocean carriers have struggled to bring up freight rates in the face of overcapacity as new ships are delivered. The end-of-year import pullback in the U.S. implies further pressure on spot rates.
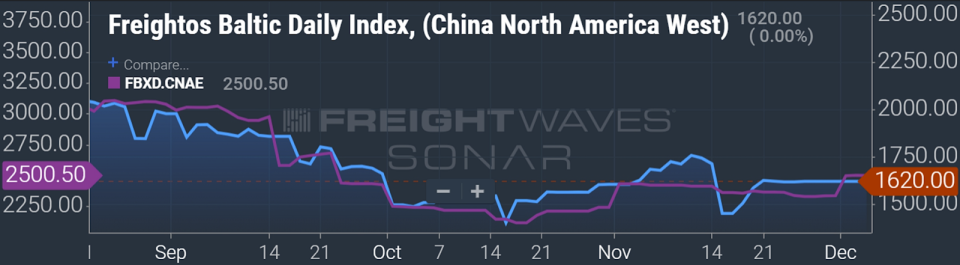
The Freightos Baltic Daily Index (FBX) assessed China-West Coast spot rates at $1,620 per forty-foot equivalent unit on Tuesday, down 21% from the peak-season high in August.
The FBX China-East Coast spot rate assessment was $2,501 per FEU, down 18% from the high in August.
Click for more articles by Greg Miller
Related articles:
‘Dire’ scenario for shipping lines more likely as spot rates fall back
Massive impairment charge drags shipping line Zim to $2.3B loss
Shipping line Hapag-Lloyd suffers ‘big miss’ as Q3 profits slump
Maersk cutting 10,000 jobs in face of ‘worsening market conditions’
East Coast vs. West Coast: More imports shift back to Pacific ports
The post US imports dragged down by seasonality, Panama Canal crisis appeared first on FreightWaves.
