USD/CAD Technical Analysis – Loonie Hits 3-Month High
To receive Ilya's analysis directly via email, please SIGN UP HERE
Talking Points:
USD/CAD Technical Strategy: Flat
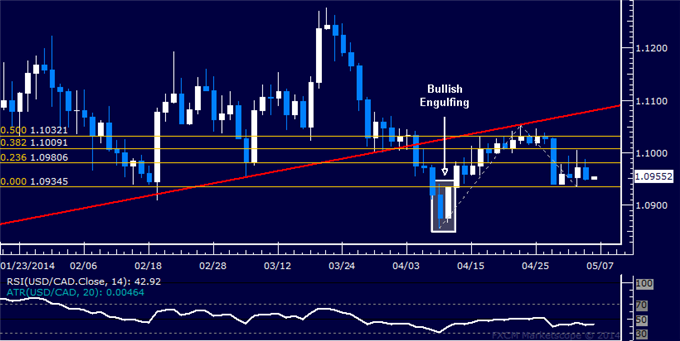
Support: 1.0859 (38.2% Fib ret.), 1.0730 (50% Fib ret.)
Resistance: 1.0975 (trend line), 1.1126 (horizontal pivot)
The US Dollar continued to slide against its Canadian namesake having reversing downward as expected after finding resistance above the 1.12 figure. A break below support at 1.0859, the 38% Fibonacci retracement, exposes the 50% level at 1.0730. Alternatively, a reversal above support-turned-resistance at a rising trend line set from mid-January (now at 1.0975) targets a horizontal pivot level at 1.1126.
Risk/reward considerations argue against entering short with prices trading in close proximity to relevant support. On the other hand, taking up the long side looks premature absent a defined bullish reversal signal. With that in mind, we will remain flat for now.
Confirm your chart-based trade setups with the Technical Analyzer. New to FX? Start Here!
Daily Chart - Created Using FXCM Marketscope 2.0
--- Written by Ilya Spivak, Currency Strategist for DailyFX.com
DailyFX provides forex news and technical analysis on the trends that influence the global currency markets.
Learn forex trading with a free practice account and trading charts from FXCM.
