USD/JPY Technical Analysis 06.03.2013
USD/JPY Technical Analysis- Prices declined as expected after putting in a Bearish Engulfing candlestick pattern. The pair has now taken out support at 100.68, the 23.6% Fibonacci retracement, exposing the 38.2% retracement at 98.80. The 100.68 level has been recast as near-term resistance, with a reversal above that eyeingthe May 29 highat 102.52.
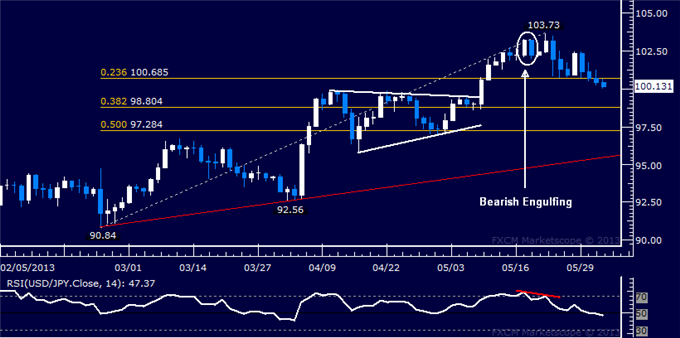
Daily Chart - Created Using FXCM Marketscope 2.0
--- Written by Ilya Spivak, Currency Strategist for Dailyfx.com
To contact Ilya, e-mail ispivak@dailyfx.com. Follow Ilya on Twitter at @IlyaSpivak
To be added to Ilya's e-mail distribution list, please CLICK HERE
New to FX? Watch this Video. For live market updates, visit the Real Time News Feed
DailyFX provides forex news and technical analysis on the trends that influence the global currency markets.
Learn forex trading with a free practice account and trading charts from FXCM.
