USD/JPY Technical Analysis – Yen Probes Below 102.00 Again
To receive Ilya's analysis directly via email, please SIGN UP HERE
Talking Points:
USD/JPY Technical Strategy: Flat
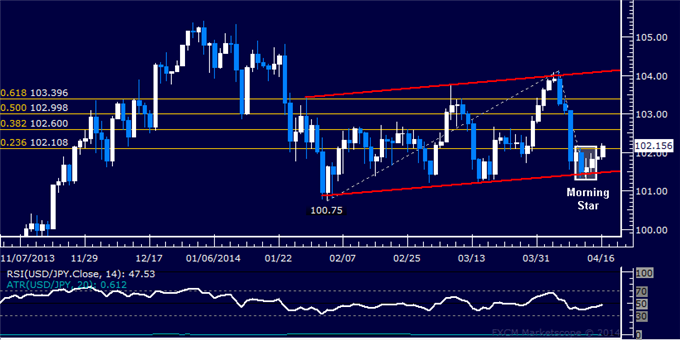
Support: 101.59 (23.6% Fib exp.), 100.90 (38.2% Fib ret.)
Resistance: 102.96 (Feb 11 high)
The Japanese Yen is launching a swift recovery against the US Dollar after putting in a Hanging Man candlestick, with USD/JPY on pace to issue largest drop in eight days. A break below support at 101.59, the 23.6% Fibonacci expansion, targets the 38.2% level at 100.90. Near-term resistance is at 102.69, the February 11 high.
A short position at current levels looks unattractive from a risk/reward perspective as prices trade squarely at relevant support. On the other hand, a long trade seems premature absent confirmation of reversal. On balance, we will remain on the sidelines for now.
Confirm your chart-based trade setups with the Technical Analyzer. New to FX? Start Here!
Daily Chart - Created Using FXCM Marketscope 2.0
--- Written by Ilya Spivak, Currency Strategist for DailyFX.com
DailyFX provides forex news and technical analysis on the trends that influence the global currency markets.
Learn forex trading with a free practice account and trading charts from FXCM.
