Here’s What Valmont Industries, Inc.’s (NYSE:VMI) P/E Is Telling Us

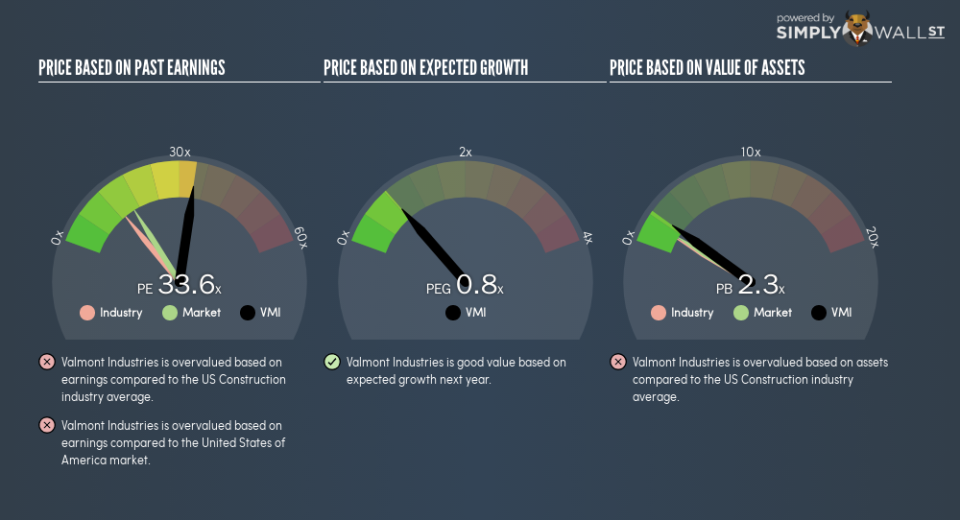
The goal of this article is to teach you how to use price to earnings ratios (P/E ratios). To keep it practical, we’ll show how Valmont Industries, Inc.’s (NYSE:VMI) P/E ratio could help you assess the value on offer. Valmont Industries has a price to earnings ratio of 33.57, based on the last twelve months. That is equivalent to an earnings yield of about 3.0%.
See our latest analysis for Valmont Industries
How Do I Calculate A Price To Earnings Ratio?
The formula for price to earnings is:
Price to Earnings Ratio = Share Price ÷ Earnings per Share (EPS)
Or for Valmont Industries:
P/E of 33.57 = $109.23 ÷ $3.25 (Based on the trailing twelve months to September 2018.)
Is A High P/E Ratio Good?
A higher P/E ratio implies that investors pay a higher price for the earning power of the business. That isn’t necessarily good or bad, but a high P/E implies relatively high expectations of what a company can achieve in the future.
How Growth Rates Impact P/E Ratios
Probably the most important factor in determining what P/E a company trades on is the earnings growth. When earnings grow, the ‘E’ increases, over time. That means even if the current P/E is high, it will reduce over time if the share price stays flat. So while a stock may look expensive based on past earnings, it could be cheap based on future earnings.
Valmont Industries shrunk earnings per share by 61% over the last year. But over the longer term (3 years), earnings per share have increased by 17%. And it has shrunk its earnings per share by 14% per year over the last five years. This growth rate might warrant a below average P/E ratio.
How Does Valmont Industries’s P/E Ratio Compare To Its Peers?
The P/E ratio essentially measures market expectations of a company. The image below shows that Valmont Industries has a higher P/E than the average (12.9) P/E for companies in the construction industry.
Valmont Industries’s P/E tells us that market participants think the company will perform better than its industry peers, going forward. Shareholders are clearly optimistic, but the future is always uncertain. So investors should always consider the P/E ratio alongside other factors, such as whether company directors have been buying shares.
Remember: P/E Ratios Don’t Consider The Balance Sheet
Don’t forget that the P/E ratio considers market capitalization. In other words, it does not consider any debt or cash that the company may have on the balance sheet. Theoretically, a business can improve its earnings (and produce a lower P/E in the future), by taking on debt (or spending its remaining cash).
Such expenditure might be good or bad, in the long term, but the point here is that the balance sheet is not reflected by this ratio.
Is Debt Impacting Valmont Industries’s P/E?
Valmont Industries has net debt worth 18% of its market capitalization. This could bring some additional risk, and reduce the number of investment options for management; worth remembering if you compare its P/E to businesses without debt.
The Verdict On Valmont Industries’s P/E Ratio
Valmont Industries’s P/E is 33.6 which is above average (16.1) in the US market. With modest debt but no EPS growth in the last year, it’s fair to say the P/E implies some optimism about future earnings, from the market.
Investors have an opportunity when market expectations about a stock are wrong. If the reality for a company is better than it expects, you can make money by buying and holding for the long term. So this free report on the analyst consensus forecasts could help you make a master move on this stock.
Of course you might be able to find a better stock than Valmont Industries. So you may wish to see this free collection of other companies that have grown earnings strongly.
To help readers see past the short term volatility of the financial market, we aim to bring you a long-term focused research analysis purely driven by fundamental data. Note that our analysis does not factor in the latest price-sensitive company announcements.
The author is an independent contributor and at the time of publication had no position in the stocks mentioned. For errors that warrant correction please contact the editor at editorial-team@simplywallst.com.
