Do You Like Value Line, Inc. (NASDAQ:VALU) At This P/E Ratio?

Want to participate in a short research study? Help shape the future of investing tools and receive a $20 prize!
The goal of this article is to teach you how to use price to earnings ratios (P/E ratios). We’ll look at Value Line, Inc.’s (NASDAQ:VALU) P/E ratio and reflect on what it tells us about the company’s share price. Based on the last twelve months, Value Line’s P/E ratio is 11.44. That means that at current prices, buyers pay $11.44 for every $1 in trailing yearly profits.
See our latest analysis for Value Line
How Do You Calculate A P/E Ratio?
The formula for P/E is:
Price to Earnings Ratio = Share Price ÷ Earnings per Share (EPS)
Or for Value Line:
P/E of 11.44 = $19.89 ÷ $1.74 (Based on the trailing twelve months to October 2018.)
Is A High P/E Ratio Good?
A higher P/E ratio means that investors are paying a higher price for each $1 of company earnings. That isn’t a good or a bad thing on its own, but a high P/E means that buyers have a higher opinion of the business’s prospects, relative to stocks with a lower P/E.
How Growth Rates Impact P/E Ratios
P/E ratios primarily reflect market expectations around earnings growth rates. Earnings growth means that in the future the ‘E’ will be higher. That means even if the current P/E is high, it will reduce over time if the share price stays flat. Then, a lower P/E should attract more buyers, pushing the share price up.
It’s nice to see that Value Line grew EPS by a stonking 148% in the last year. And its annual EPS growth rate over 5 years is 18%. I’d therefore be a little surprised if its P/E ratio was not relatively high.
How Does Value Line’s P/E Ratio Compare To Its Peers?
The P/E ratio essentially measures market expectations of a company. If you look at the image below, you can see Value Line has a lower P/E than the average (22.5) in the capital markets industry classification.
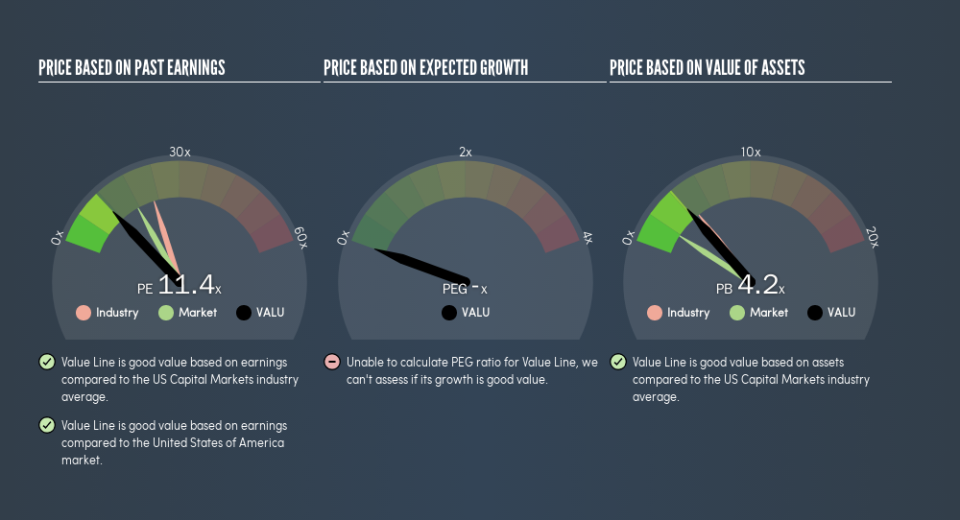
This suggests that market participants think Value Line will underperform other companies in its industry. Many investors like to buy stocks when the market is pessimistic about their prospects. It is arguably worth checking if insiders are buying shares, because that might imply they believe the stock is undervalued.
Don’t Forget: The P/E Does Not Account For Debt or Bank Deposits
The ‘Price’ in P/E reflects the market capitalization of the company. In other words, it does not consider any debt or cash that the company may have on the balance sheet. In theory, a company can lower its future P/E ratio by using cash or debt to invest in growth.
Spending on growth might be good or bad a few years later, but the point is that the P/E ratio does not account for the option (or lack thereof).
Is Debt Impacting Value Line’s P/E?
Since Value Line holds net cash of US$24m, it can spend on growth, justifying a higher P/E ratio than otherwise.
The Verdict On Value Line’s P/E Ratio
Value Line trades on a P/E ratio of 11.4, which is below the US market average of 17.5. The net cash position gives plenty of options to the business, and the recent improvement in EPS is good to see. The below average P/E ratio suggests that market participants don’t believe the strong growth will continue.
Investors should be looking to buy stocks that the market is wrong about. If the reality for a company is not as bad as the P/E ratio indicates, then the share price should increase as the market realizes this. Although we don’t have analyst forecasts, you might want to assess this data-rich visualization of earnings, revenue and cash flow.
You might be able to find a better buy than Value Line. If you want a selection of possible winners, check out this free list of interesting companies that trade on a P/E below 20 (but have proven they can grow earnings).
We aim to bring you long-term focused research analysis driven by fundamental data. Note that our analysis may not factor in the latest price-sensitive company announcements or qualitative material.
If you spot an error that warrants correction, please contact the editor at editorial-team@simplywallst.com. This article by Simply Wall St is general in nature. It does not constitute a recommendation to buy or sell any stock, and does not take account of your objectives, or your financial situation. Simply Wall St has no position in the stocks mentioned. Thank you for reading.
