Has Vanda Pharmaceuticals Inc.'s (NASDAQ:VNDA) Impressive Stock Performance Got Anything to Do With Its Fundamentals?
Vanda Pharmaceuticals' (NASDAQ:VNDA) stock is up by a considerable 10% over the past month. We wonder if and what role the company's financials play in that price change as a company's long-term fundamentals usually dictate market outcomes. In this article, we decided to focus on Vanda Pharmaceuticals' ROE.
Return on equity or ROE is a key measure used to assess how efficiently a company's management is utilizing the company's capital. In simpler terms, it measures the profitability of a company in relation to shareholder's equity.
See our latest analysis for Vanda Pharmaceuticals
How To Calculate Return On Equity?
The formula for return on equity is:
Return on Equity = Net Profit (from continuing operations) ÷ Shareholders' Equity
So, based on the above formula, the ROE for Vanda Pharmaceuticals is:
3.6% = US$18m ÷ US$502m (Based on the trailing twelve months to March 2022).
The 'return' is the profit over the last twelve months. Another way to think of that is that for every $1 worth of equity, the company was able to earn $0.04 in profit.
What Has ROE Got To Do With Earnings Growth?
We have already established that ROE serves as an efficient profit-generating gauge for a company's future earnings. Depending on how much of these profits the company reinvests or "retains", and how effectively it does so, we are then able to assess a company’s earnings growth potential. Generally speaking, other things being equal, firms with a high return on equity and profit retention, have a higher growth rate than firms that don’t share these attributes.
A Side By Side comparison of Vanda Pharmaceuticals' Earnings Growth And 3.6% ROE
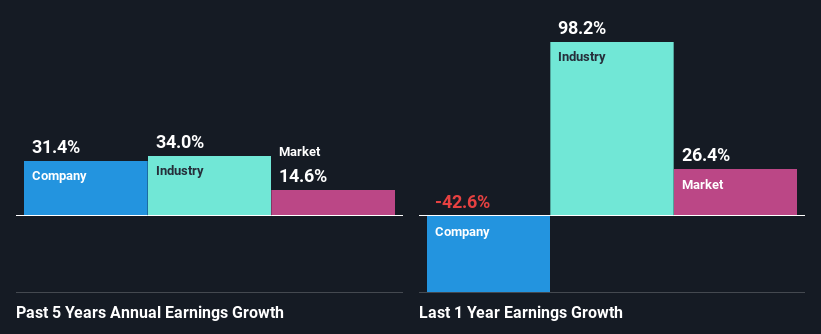
As you can see, Vanda Pharmaceuticals' ROE looks pretty weak. Not just that, even compared to the industry average of 21%, the company's ROE is entirely unremarkable. Despite this, surprisingly, Vanda Pharmaceuticals saw an exceptional 31% net income growth over the past five years. We reckon that there could be other factors at play here. Such as - high earnings retention or an efficient management in place.
As a next step, we compared Vanda Pharmaceuticals' net income growth with the industry and found that the company has a similar growth figure when compared with the industry average growth rate of 34% in the same period.
Earnings growth is an important metric to consider when valuing a stock. What investors need to determine next is if the expected earnings growth, or the lack of it, is already built into the share price. Doing so will help them establish if the stock's future looks promising or ominous. One good indicator of expected earnings growth is the P/E ratio which determines the price the market is willing to pay for a stock based on its earnings prospects. So, you may want to check if Vanda Pharmaceuticals is trading on a high P/E or a low P/E, relative to its industry.
Is Vanda Pharmaceuticals Making Efficient Use Of Its Profits?
Vanda Pharmaceuticals doesn't pay any dividend currently which essentially means that it has been reinvesting all of its profits into the business. This definitely contributes to the high earnings growth number that we discussed above.
Summary
On the whole, we do feel that Vanda Pharmaceuticals has some positive attributes. Despite its low rate of return, the fact that the company reinvests a very high portion of its profits into its business, no doubt contributed to its high earnings growth. While we won't completely dismiss the company, what we would do, is try to ascertain how risky the business is to make a more informed decision around the company. Our risks dashboard will have the 1 risk we have identified for Vanda Pharmaceuticals.
Have feedback on this article? Concerned about the content? Get in touch with us directly. Alternatively, email editorial-team (at) simplywallst.com.
This article by Simply Wall St is general in nature. We provide commentary based on historical data and analyst forecasts only using an unbiased methodology and our articles are not intended to be financial advice. It does not constitute a recommendation to buy or sell any stock, and does not take account of your objectives, or your financial situation. We aim to bring you long-term focused analysis driven by fundamental data. Note that our analysis may not factor in the latest price-sensitive company announcements or qualitative material. Simply Wall St has no position in any stocks mentioned.
