Varex Imaging Corporation's (NASDAQ:VREX) Stock Is Rallying But Financials Look Ambiguous: Will The Momentum Continue?
Most readers would already be aware that Varex Imaging's (NASDAQ:VREX) stock increased significantly by 26% over the past week. However, we wonder if the company's inconsistent financials would have any adverse impact on the current share price momentum. Particularly, we will be paying attention to Varex Imaging's ROE today.
Return on equity or ROE is a key measure used to assess how efficiently a company's management is utilizing the company's capital. Simply put, it is used to assess the profitability of a company in relation to its equity capital.
Check out our latest analysis for Varex Imaging
How Is ROE Calculated?
Return on equity can be calculated by using the formula:
Return on Equity = Net Profit (from continuing operations) ÷ Shareholders' Equity
So, based on the above formula, the ROE for Varex Imaging is:
5.5% = US$29m ÷ US$533m (Based on the trailing twelve months to March 2023).
The 'return' is the amount earned after tax over the last twelve months. Another way to think of that is that for every $1 worth of equity, the company was able to earn $0.05 in profit.
What Is The Relationship Between ROE And Earnings Growth?
We have already established that ROE serves as an efficient profit-generating gauge for a company's future earnings. We now need to evaluate how much profit the company reinvests or "retains" for future growth which then gives us an idea about the growth potential of the company. Assuming everything else remains unchanged, the higher the ROE and profit retention, the higher the growth rate of a company compared to companies that don't necessarily bear these characteristics.
A Side By Side comparison of Varex Imaging's Earnings Growth And 5.5% ROE
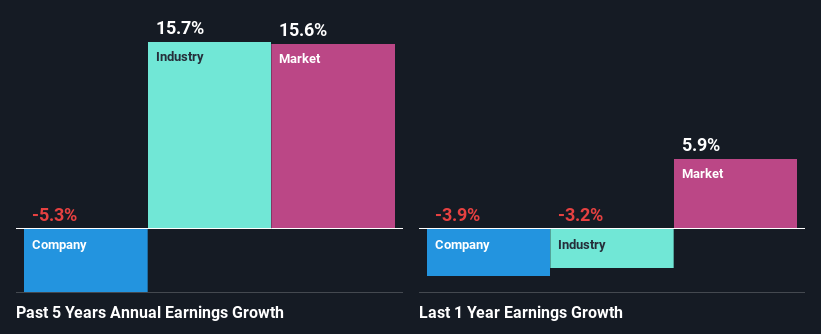
When you first look at it, Varex Imaging's ROE doesn't look that attractive. Next, when compared to the average industry ROE of 10%, the company's ROE leaves us feeling even less enthusiastic. Given the circumstances, the significant decline in net income by 5.3% seen by Varex Imaging over the last five years is not surprising. We reckon that there could also be other factors at play here. For instance, the company has a very high payout ratio, or is faced with competitive pressures.
That being said, we compared Varex Imaging's performance with the industry and were concerned when we found that while the company has shrunk its earnings, the industry has grown its earnings at a rate of 16% in the same period.
Earnings growth is a huge factor in stock valuation. The investor should try to establish if the expected growth or decline in earnings, whichever the case may be, is priced in. This then helps them determine if the stock is placed for a bright or bleak future. What is VREX worth today? The intrinsic value infographic in our free research report helps visualize whether VREX is currently mispriced by the market.
Is Varex Imaging Efficiently Re-investing Its Profits?
Varex Imaging doesn't pay any dividend, meaning that potentially all of its profits are being reinvested in the business, which doesn't explain why the company's earnings have shrunk if it is retaining all of its profits. So there might be other factors at play here which could potentially be hampering growth. For example, the business has faced some headwinds.
Conclusion
On the whole, we feel that the performance shown by Varex Imaging can be open to many interpretations. While the company does have a high rate of profit retention, its low rate of return is probably hampering its earnings growth. With that said, we studied the latest analyst forecasts and found that while the company has shrunk its earnings in the past, analysts expect its earnings to grow in the future. To know more about the latest analysts predictions for the company, check out this visualization of analyst forecasts for the company.
Have feedback on this article? Concerned about the content? Get in touch with us directly. Alternatively, email editorial-team (at) simplywallst.com.
This article by Simply Wall St is general in nature. We provide commentary based on historical data and analyst forecasts only using an unbiased methodology and our articles are not intended to be financial advice. It does not constitute a recommendation to buy or sell any stock, and does not take account of your objectives, or your financial situation. We aim to bring you long-term focused analysis driven by fundamental data. Note that our analysis may not factor in the latest price-sensitive company announcements or qualitative material. Simply Wall St has no position in any stocks mentioned.
Join A Paid User Research Session
You’ll receive a US$30 Amazon Gift card for 1 hour of your time while helping us build better investing tools for the individual investors like yourself. Sign up here
