VEON Ltd (VEON): A Deep Dive into Its Performance Potential
Long-established in the Telecommunication Services industry, VEON Ltd (NASDAQ:VEON) has enjoyed a stellar reputation. It has recently witnessed a daily gain of 9.78%, juxtaposed with a three-month change of 3.32%. However, fresh insights from the GF Score hint at potential headwinds. Notably, its diminished rankings in financial strength, growth, and valuation suggest that the company might not live up to its historical performance. Join us as we dive deep into these pivotal metrics to unravel the evolving narrative of VEON Ltd.
Understanding the GF Score
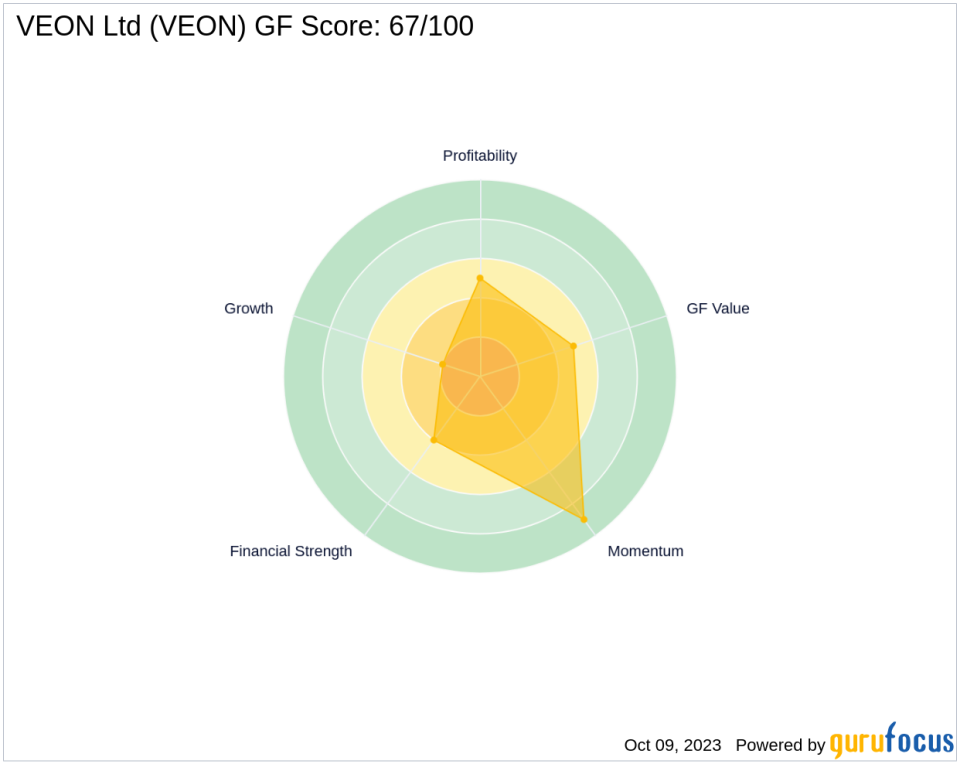
The GF Score is a stock performance ranking system developed by GuruFocus using five aspects of valuation, which has been found to be closely correlated to the long-term performances of stocks by backtesting from 2006 to 2021. The stocks with a higher GF Score generally generate higher returns than those with a lower GF Score. Therefore, when picking stocks, investors should invest in companies with high GF Scores. The GF Score ranges from 0 to 100, with 100 as the highest rank.
Financial strength rank: 4/10
Profitability rank: 5/10
Growth rank: 2/10
GF Value rank: 5/10
Momentum rank: 9/10
Based on the above method, GuruFocus assigned VEON Ltd the GF Score of 67 out of 100, which signals poor future outperformance potential.
VEON Ltd: A Snapshot of the Business
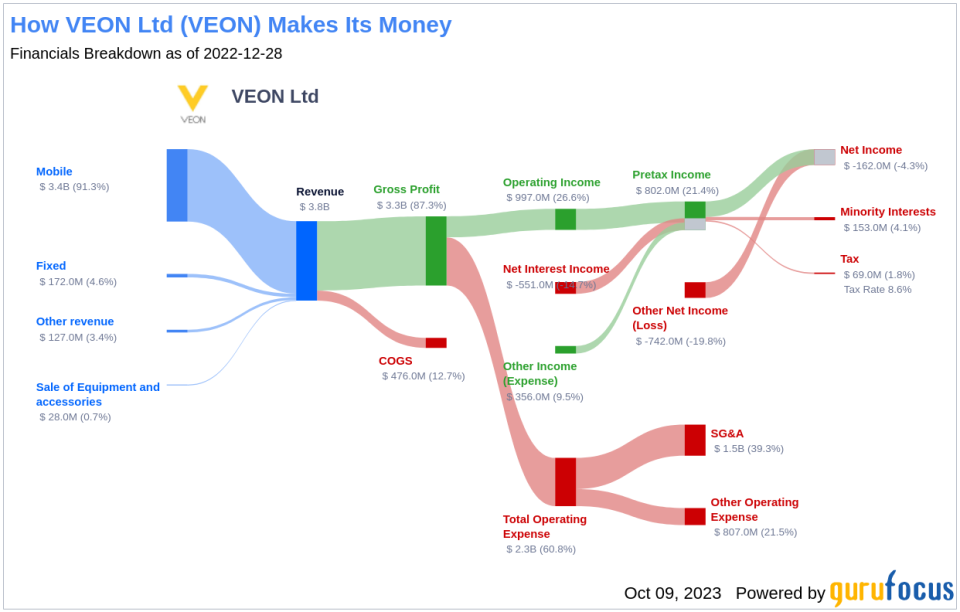
VEON Ltd is a global provider of connectivity and internet services. The company provides more than 210 million customers with voice, fixed broadband, data and digital services. Currently, the company offers services to customers in 10 countries: Russia, Pakistan, Algeria, Uzbekistan, Ukraine, Bangladesh, Kazakhstan, Kyrgyzstan, Armenia and Georgia. The reportable segments currently consist of the following five segments: Pakistan, Ukraine, Kazakhstan, Bangladesh and Uzbekistan. The company provides services under the Beeline, Kyivstar, banglalink, Jazz and Djezzy brands. The maximum revenue derives from Russia.
Financial Strength Analysis
VEON Ltd's financial strength indicators present some concerning insights about the company's balance sheet health. VEON Ltd has an interest coverage ratio of 3.45, which positions it worse than 63.25% of 302 companies in the Telecommunication Services industry. This ratio highlights potential challenges the company might face when handling its interest expenses on outstanding debt. It's worth noting that the esteemed investor Benjamin Graham typically favored companies with an interest coverage ratio of at least five.
The company's Altman Z-Scoreis just 0.24, which is below the distress zone of 1.81. This suggests that the company may face financial distress over the next few years.
Additionally, the company's low cash-to-debt ratio at 0.46 indicates a struggle in handling existing debt levels.
The company's debt-to-equity ratio is 7.24, which is worse than 96.51% of 344 companies in the Telecommunication Services industry. A high debt-to-equity ratio suggests over-reliance on borrowing and vulnerability to market fluctuations.
Additionally, the company's debt-to-Ebitda ratio is 5.8, which is above Joel Tillinghast's warning level of 4 and is worse than 84.86% of 317 companies in the Telecommunication Services industry. Tillinghast said in his book Big Money Think's Small: Biases, Blind Spots, and Smarter Investing that a high debt-to-Ebitda ratio can be a red flag unless tangible assets cover the debt.
Profitability Analysis
VEON Ltd's low Profitability rank can also raise warning signals.
Growth Prospects
A lack of significant growth is another area where VEON Ltd seems to falter, as evidenced by the company's low Growth rank.
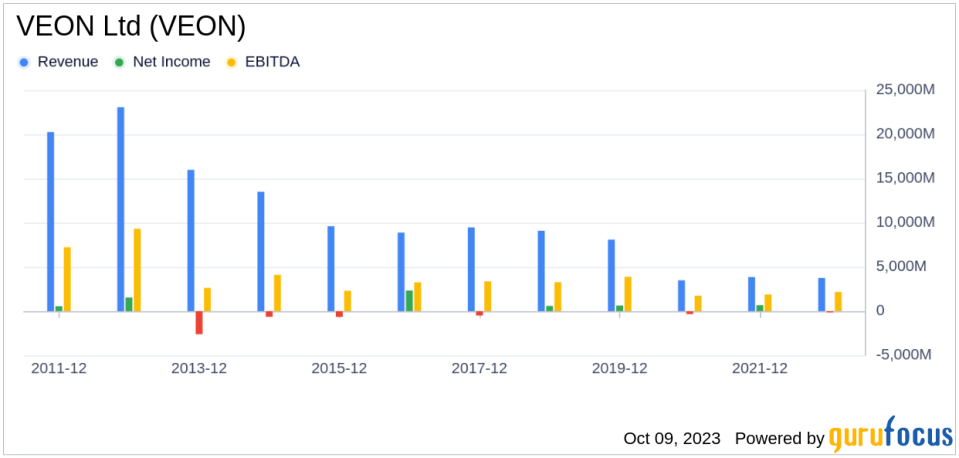
The company's revenue has declined by -21.5 per year over the past three years, which underperforms worse than 94.1% of 373 companies in the Telecommunication Services industry. Stagnating revenues may pose concerns in a fast-evolving market.
Over the past five years, VEON Ltd has witnessed a decline in its earnings before interest, taxes, depreciation, and amortization (EBITDA). The three-year growth rate is recorded at -16.5, while the five-year growth rate is at -11.4. These figures underscore potential challenges in the company's profitability.
Lastly, VEON Ltd predictability rank is just one star out of five, adding to investor uncertainty regarding revenue and earnings consistency.
Conclusion
Given VEON Ltd's financial strength, profitability, and growth metrics, the GF Score highlights the firm's unparalleled position for potential underperformance. While the company has a rich history in the Telecommunication Services industry, its current financial indicators and growth prospects suggest that it may struggle to maintain its past performance. Investors should consider these factors when making investment decisions.
GuruFocus Premium members can find more companies with strong GF Scores using the following screener link: GF Score Screen
This article, generated by GuruFocus, is designed to provide general insights and is not tailored financial advice. Our commentary is rooted in historical data and analyst projections, utilizing an impartial methodology, and is not intended to serve as specific investment guidance. It does not formulate a recommendation to purchase or divest any stock and does not consider individual investment objectives or financial circumstances. Our objective is to deliver long-term, fundamental data-driven analysis. Be aware that our analysis might not incorporate the most recent, price-sensitive company announcements or qualitative information. GuruFocus holds no position in the stocks mentioned herein.
This article first appeared on GuruFocus.
