Verisk Analytics (VRSK): A Fairly Valued Stock with Strong Profitability
Verisk Analytics Inc (NASDAQ:VRSK) experienced a daily loss of -1.14%, and a 3-month gain of 9.42%. With an Earnings Per Share (EPS) of 3.31, the question arises: is the stock fairly valued? This article delves into the valuation analysis of Verisk Analytics (NASDAQ:VRSK), providing a comprehensive look at the company's financial performance and intrinsic value.
Company Overview
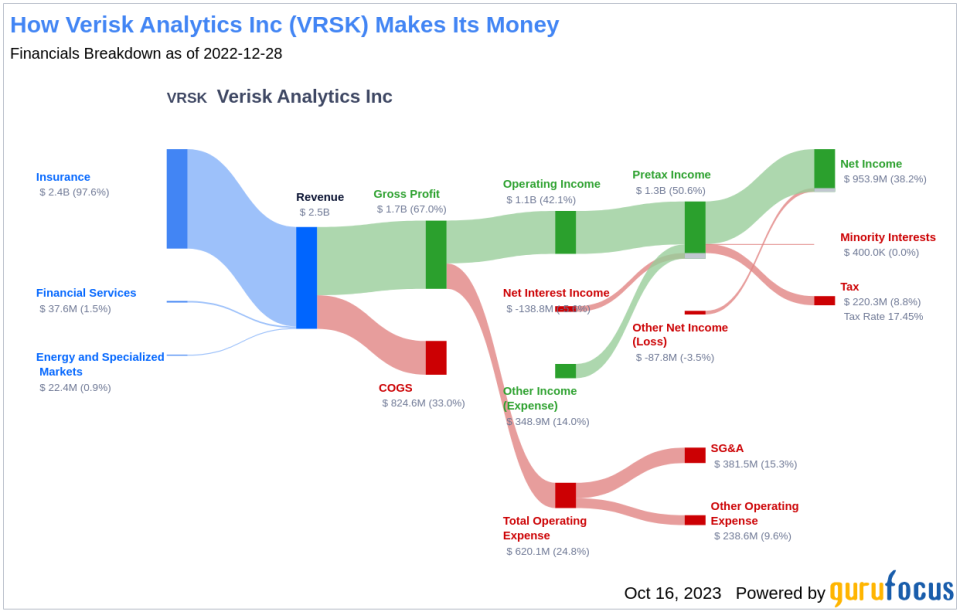
Verisk Analytics Inc is a leading data analytics provider, offering decision support and risk-management solutions to the financial industry. The company's predictive analytics are used in various fields including rating applications, underwriting, claims, catastrophe and weather risk assessment, global risk assessment, natural resources intelligence, and economic forecasting. The company operates through three segments: Insurance; Energy and Specialized Markets; and Financial Services, with the Insurance segment generating the maximum revenue.
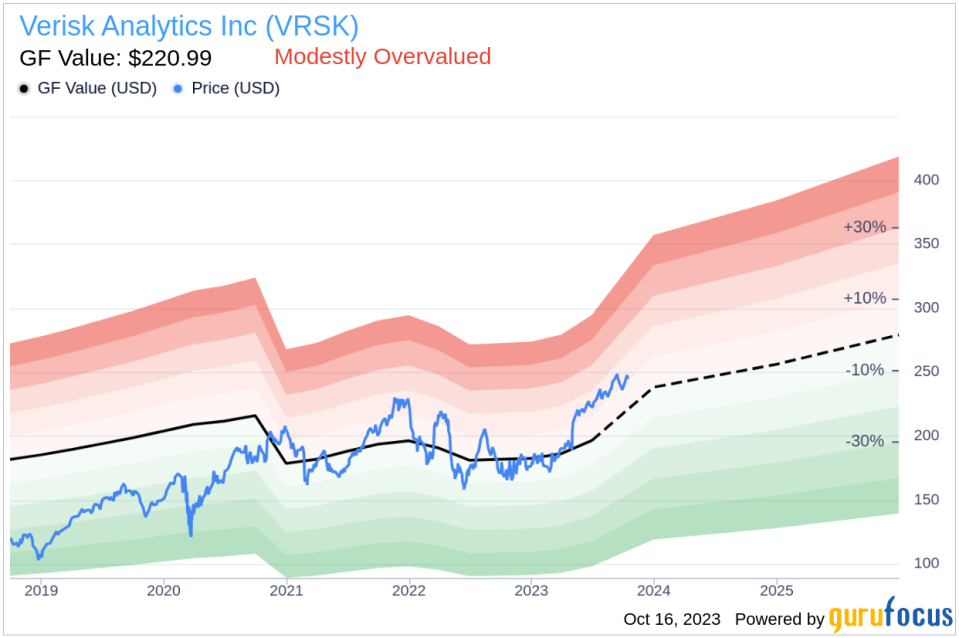
The company's stock price stands at $244.78, compared to its Fair Value (GF Value) of $220.99. This comparison serves as a prelude to a deeper exploration of the company's value, ingeniously integrating financial assessment with essential company details.
GF Value: A Measure of Intrinsic Value
The GF Value is an estimation of a stock's intrinsic value, calculated based on historical multiples, a GuruFocus adjustment factor, and future business performance estimates. The GF Value Line represents the ideal fair value at which the stock should be traded.
For Verisk Analytics (NASDAQ:VRSK), the GF Value indicates that the stock is fairly valued. The stock's fair value is computed considering historical multiples, the company's past business growth, and analyst estimates of future business performance. If the share price significantly deviates from the GF Value Line, it indicates that the stock may be overvalued or undervalued, which in turn, affects its future returns. Given its current price of $244.78 per share, Verisk Analytics stock appears to be fairly valued.
Since Verisk Analytics is fairly valued, the long-term return of its stock is likely to be close to the rate of its business growth.
Link: These companies may deliver higher future returns at reduced risk.
Financial Strength
Assessing the financial strength of a company is crucial before investing in its stock. Companies with poor financial strength pose a higher risk of permanent loss. The cash-to-debt ratio and interest coverage provide a good understanding of a company's financial strength. Verisk Analytics has a cash-to-debt ratio of 0.1, which ranks worse than 83.8% of 1043 companies in the Business Services industry. The overall financial strength of Verisk Analytics is rated 5 out of 10, indicating fair financial strength.

Profitability and Growth
Investing in profitable companies, especially those with consistent profitability over the long term, poses less risk. Verisk Analytics has been profitable 10 years over the past decade. Over the past twelve months, the company had a revenue of $2.30 billion and Earnings Per Share (EPS) of $3.31. Its operating margin is 32.18%, which ranks better than 93.93% of 1055 companies in the Business Services industry. Overall, GuruFocus ranks the profitability of Verisk Analytics at 9 out of 10, indicating strong profitability.
Growth is a significant factor in the valuation of a company. The faster a company is growing, the more likely it is to be creating value for shareholders, especially if the growth is profitable. The 3-year average annual revenue growth rate of Verisk Analytics is 0.1%, which ranks worse than 63.55% of 974 companies in the Business Services industry. The 3-year average EBITDA growth rate is 21.4%, which ranks better than 68.28% of 845 companies in the Business Services industry.
ROIC vs WACC
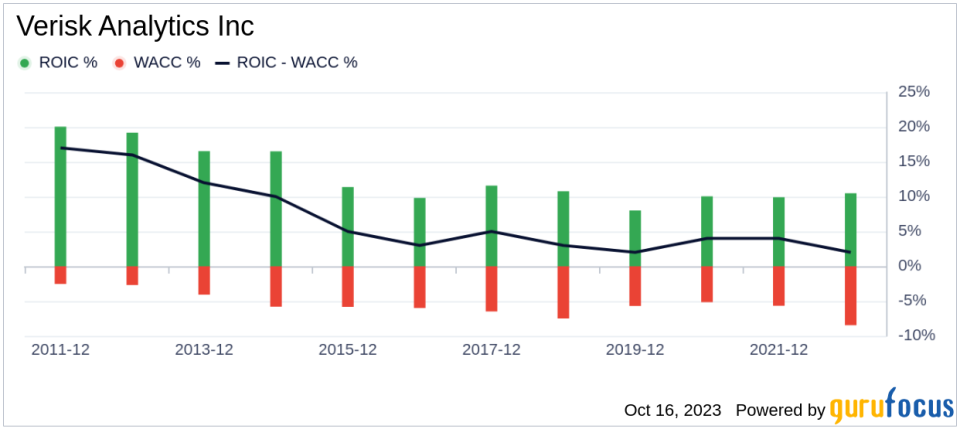
Comparing a company's return on invested capital (ROIC) and the weighted cost of capital (WACC) is another way to assess its profitability. ROIC measures how well a company generates cash flow relative to the capital it has invested in its business. WACC is the rate that a company is expected to pay on average to all its security holders to finance its assets. Ideally, the ROIC should be higher than the WACC. For the past 12 months, Verisk Analytics's ROIC is 9.06, and its WACC is 9.45.
Conclusion
In conclusion, the stock of Verisk Analytics (NASDAQ:VRSK) appears to be fairly valued. The company's financial condition is fair and its profitability is strong. Its growth ranks better than 68.28% of 845 companies in the Business Services industry. To learn more about Verisk Analytics stock, you can check out its 30-Year Financials here.
To find out the high-quality companies that may deliver above-average returns, please check out GuruFocus High Quality Low Capex Screener.
This article, generated by GuruFocus, is designed to provide general insights and is not tailored financial advice. Our commentary is rooted in historical data and analyst projections, utilizing an impartial methodology, and is not intended to serve as specific investment guidance. It does not formulate a recommendation to purchase or divest any stock and does not consider individual investment objectives or financial circumstances. Our objective is to deliver long-term, fundamental data-driven analysis. Be aware that our analysis might not incorporate the most recent, price-sensitive company announcements or qualitative information. GuruFocus holds no position in the stocks mentioned herein.
This article first appeared on GuruFocus.
