Vermilion Energy (TSE:VET) delivers shareholders splendid 47% CAGR over 3 years, surging 6.6% in the last week alone
It might seem bad, but the worst that can happen when you buy a stock (without leverage) is that its share price goes to zero. But if you buy shares in a really great company, you can more than double your money. For instance the Vermilion Energy Inc. (TSE:VET) share price is 208% higher than it was three years ago. That sort of return is as solid as granite. Also pleasing for shareholders was the 20% gain in the last three months. The company reported its financial results recently; you can catch up on the latest numbers by reading our company report.
The past week has proven to be lucrative for Vermilion Energy investors, so let's see if fundamentals drove the company's three-year performance.
See our latest analysis for Vermilion Energy
In his essay The Superinvestors of Graham-and-Doddsville Warren Buffett described how share prices do not always rationally reflect the value of a business. One flawed but reasonable way to assess how sentiment around a company has changed is to compare the earnings per share (EPS) with the share price.
During three years of share price growth, Vermilion Energy moved from a loss to profitability. Given the importance of this milestone, it's not overly surprising that the share price has increased strongly.
The graphic below depicts how EPS has changed over time (unveil the exact values by clicking on the image).
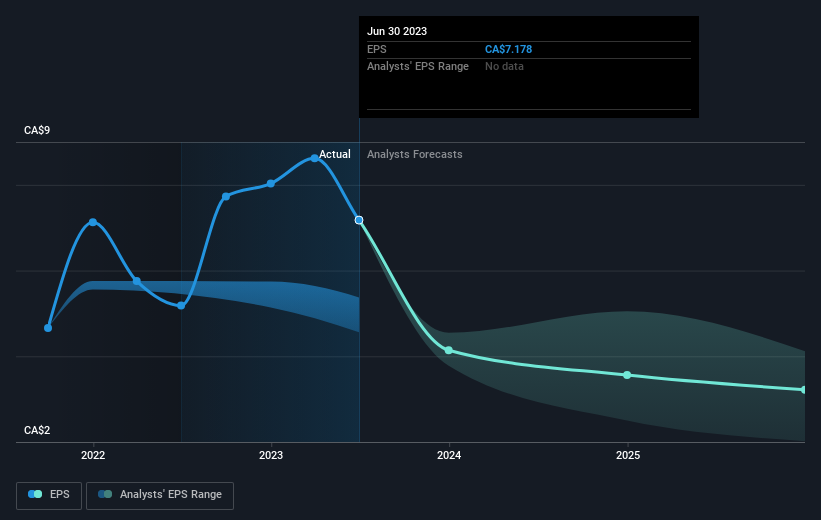
We know that Vermilion Energy has improved its bottom line over the last three years, but what does the future have in store? You can see how its balance sheet has strengthened (or weakened) over time in this free interactive graphic.
What About Dividends?
When looking at investment returns, it is important to consider the difference between total shareholder return (TSR) and share price return. The TSR is a return calculation that accounts for the value of cash dividends (assuming that any dividend received was reinvested) and the calculated value of any discounted capital raisings and spin-offs. So for companies that pay a generous dividend, the TSR is often a lot higher than the share price return. As it happens, Vermilion Energy's TSR for the last 3 years was 215%, which exceeds the share price return mentioned earlier. The dividends paid by the company have thusly boosted the total shareholder return.
A Different Perspective
While the broader market gained around 3.2% in the last year, Vermilion Energy shareholders lost 39% (even including dividends). However, keep in mind that even the best stocks will sometimes underperform the market over a twelve month period. Unfortunately, last year's performance may indicate unresolved challenges, given that it was worse than the annualised loss of 7% over the last half decade. Generally speaking long term share price weakness can be a bad sign, though contrarian investors might want to research the stock in hope of a turnaround. It's always interesting to track share price performance over the longer term. But to understand Vermilion Energy better, we need to consider many other factors. Even so, be aware that Vermilion Energy is showing 2 warning signs in our investment analysis , and 1 of those doesn't sit too well with us...
Of course Vermilion Energy may not be the best stock to buy. So you may wish to see this free collection of growth stocks.
Please note, the market returns quoted in this article reflect the market weighted average returns of stocks that currently trade on Canadian exchanges.
Have feedback on this article? Concerned about the content? Get in touch with us directly. Alternatively, email editorial-team (at) simplywallst.com.
This article by Simply Wall St is general in nature. We provide commentary based on historical data and analyst forecasts only using an unbiased methodology and our articles are not intended to be financial advice. It does not constitute a recommendation to buy or sell any stock, and does not take account of your objectives, or your financial situation. We aim to bring you long-term focused analysis driven by fundamental data. Note that our analysis may not factor in the latest price-sensitive company announcements or qualitative material. Simply Wall St has no position in any stocks mentioned.
