Vianet Group plc's (LON:VNET) Stock Is Rallying But Financials Look Ambiguous: Will The Momentum Continue?
Vianet Group's (LON:VNET) stock is up by a considerable 51% over the past three months. But the company's key financial indicators appear to be differing across the board and that makes us question whether or not the company's current share price momentum can be maintained. Specifically, we decided to study Vianet Group's ROE in this article.
Return on equity or ROE is a key measure used to assess how efficiently a company's management is utilizing the company's capital. Put another way, it reveals the company's success at turning shareholder investments into profits.
View our latest analysis for Vianet Group
How Is ROE Calculated?
The formula for return on equity is:
Return on Equity = Net Profit (from continuing operations) ÷ Shareholders' Equity
So, based on the above formula, the ROE for Vianet Group is:
1.7% = UK£443k ÷ UK£26m (Based on the trailing twelve months to September 2022).
The 'return' is the yearly profit. That means that for every £1 worth of shareholders' equity, the company generated £0.02 in profit.
What Is The Relationship Between ROE And Earnings Growth?
Thus far, we have learned that ROE measures how efficiently a company is generating its profits. Based on how much of its profits the company chooses to reinvest or "retain", we are then able to evaluate a company's future ability to generate profits. Generally speaking, other things being equal, firms with a high return on equity and profit retention, have a higher growth rate than firms that don’t share these attributes.
Vianet Group's Earnings Growth And 1.7% ROE
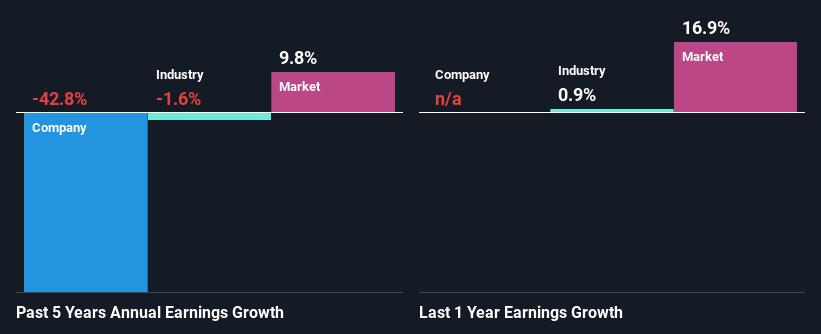
As you can see, Vianet Group's ROE looks pretty weak. Even when compared to the industry average of 11%, the ROE figure is pretty disappointing. Therefore, it might not be wrong to say that the five year net income decline of 43% seen by Vianet Group was possibly a result of it having a lower ROE. We believe that there also might be other aspects that are negatively influencing the company's earnings prospects. Such as - low earnings retention or poor allocation of capital.
Next, when we compared with the industry, which has shrunk its earnings at a rate of 1.6% in the same period, we still found Vianet Group's performance to be quite bleak, because the company has been shrinking its earnings faster than the industry.
Earnings growth is a huge factor in stock valuation. What investors need to determine next is if the expected earnings growth, or the lack of it, is already built into the share price. This then helps them determine if the stock is placed for a bright or bleak future. One good indicator of expected earnings growth is the P/E ratio which determines the price the market is willing to pay for a stock based on its earnings prospects. So, you may want to check if Vianet Group is trading on a high P/E or a low P/E, relative to its industry.
Is Vianet Group Using Its Retained Earnings Effectively?
While the company did payout a portion of its dividend in the past, it currently doesn't pay a dividend. This implies that potentially all of its profits are being reinvested in the business.
Summary
On the whole, we feel that the performance shown by Vianet Group can be open to many interpretations. Even though it appears to be retaining most of its profits, given the low ROE, investors may not be benefitting from all that reinvestment after all. The low earnings growth suggests our theory correct. With that said, we studied the latest analyst forecasts and found that while the company has shrunk its earnings in the past, analysts expect its earnings to grow in the future. To know more about the company's future earnings growth forecasts take a look at this free report on analyst forecasts for the company to find out more.
Have feedback on this article? Concerned about the content? Get in touch with us directly. Alternatively, email editorial-team (at) simplywallst.com.
This article by Simply Wall St is general in nature. We provide commentary based on historical data and analyst forecasts only using an unbiased methodology and our articles are not intended to be financial advice. It does not constitute a recommendation to buy or sell any stock, and does not take account of your objectives, or your financial situation. We aim to bring you long-term focused analysis driven by fundamental data. Note that our analysis may not factor in the latest price-sensitive company announcements or qualitative material. Simply Wall St has no position in any stocks mentioned.
Join A Paid User Research Session
You’ll receive a US$30 Amazon Gift card for 1 hour of your time while helping us build better investing tools for the individual investors like yourself. Sign up here
