Has Village Super Market, Inc. (NASDAQ:VLGE.A) Stock's Recent Performance Got Anything to Do With Its Financial Health?
Most readers would already know that Village Super Market's (NASDAQ:VLGE.A) stock increased by 6.3% over the past three months. We wonder if and what role the company's financials play in that price change as a company's long-term fundamentals usually dictate market outcomes. In this article, we decided to focus on Village Super Market's ROE.
ROE or return on equity is a useful tool to assess how effectively a company can generate returns on the investment it received from its shareholders. In simpler terms, it measures the profitability of a company in relation to shareholder's equity.
Check out our latest analysis for Village Super Market
How Is ROE Calculated?
ROE can be calculated by using the formula:
Return on Equity = Net Profit (from continuing operations) ÷ Shareholders' Equity
So, based on the above formula, the ROE for Village Super Market is:
12% = US$47m ÷ US$396m (Based on the trailing twelve months to April 2023).
The 'return' refers to a company's earnings over the last year. Another way to think of that is that for every $1 worth of equity, the company was able to earn $0.12 in profit.
What Is The Relationship Between ROE And Earnings Growth?
We have already established that ROE serves as an efficient profit-generating gauge for a company's future earnings. Based on how much of its profits the company chooses to reinvest or "retain", we are then able to evaluate a company's future ability to generate profits. Assuming all else is equal, companies that have both a higher return on equity and higher profit retention are usually the ones that have a higher growth rate when compared to companies that don't have the same features.
A Side By Side comparison of Village Super Market's Earnings Growth And 12% ROE
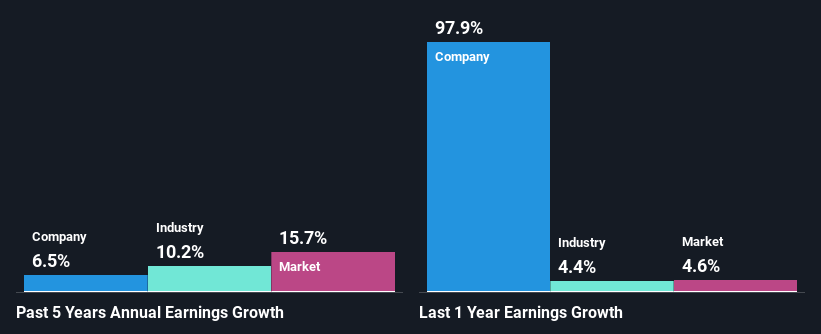
To begin with, Village Super Market seems to have a respectable ROE. Further, the company's ROE is similar to the industry average of 14%. Consequently, this likely laid the ground for the decent growth of 6.5% seen over the past five years by Village Super Market.
Next, on comparing with the industry net income growth, we found that Village Super Market's reported growth was lower than the industry growth of 10% over the last few years, which is not something we like to see.
The basis for attaching value to a company is, to a great extent, tied to its earnings growth. The investor should try to establish if the expected growth or decline in earnings, whichever the case may be, is priced in. By doing so, they will have an idea if the stock is headed into clear blue waters or if swampy waters await. One good indicator of expected earnings growth is the P/E ratio which determines the price the market is willing to pay for a stock based on its earnings prospects. So, you may want to check if Village Super Market is trading on a high P/E or a low P/E, relative to its industry.
Is Village Super Market Making Efficient Use Of Its Profits?
While Village Super Market has a three-year median payout ratio of 55% (which means it retains 45% of profits), the company has still seen a fair bit of earnings growth in the past, meaning that its high payout ratio hasn't hampered its ability to grow.
Moreover, Village Super Market is determined to keep sharing its profits with shareholders which we infer from its long history of paying a dividend for at least ten years.
Summary
Overall, we feel that Village Super Market certainly does have some positive factors to consider. The company has grown its earnings moderately as previously discussed. Still, the high ROE could have been even more beneficial to investors had the company been reinvesting more of its profits. As highlighted earlier, the current reinvestment rate appears to be quite low. So far, we've only made a quick discussion around the company's earnings growth. You can do your own research on Village Super Market and see how it has performed in the past by looking at this FREE detailed graph of past earnings, revenue and cash flows.
Have feedback on this article? Concerned about the content? Get in touch with us directly. Alternatively, email editorial-team (at) simplywallst.com.
This article by Simply Wall St is general in nature. We provide commentary based on historical data and analyst forecasts only using an unbiased methodology and our articles are not intended to be financial advice. It does not constitute a recommendation to buy or sell any stock, and does not take account of your objectives, or your financial situation. We aim to bring you long-term focused analysis driven by fundamental data. Note that our analysis may not factor in the latest price-sensitive company announcements or qualitative material. Simply Wall St has no position in any stocks mentioned.
Join A Paid User Research Session
You’ll receive a US$30 Amazon Gift card for 1 hour of your time while helping us build better investing tools for the individual investors like yourself. Sign up here
