Visa (V) Q4 Earnings Beat on Cross-Border Volume, Dividend Hiked
Visa Inc. V reported solid fourth-quarter fiscal 2023 results, driven by increased payments, cross-border volumes and processed transactions. Steady cross-border travel growth, resilient consumer spending and higher-than-expected data processing aided the results, partially offset by increased costs and client incentives.
It reported fourth-quarter fiscal 2023 earnings of $2.33 per share, which beat the Zacks Consensus Estimate of $2.23 by 4.5%. The bottom line improved 21% year over year.
Net revenues amounted to $8.6 million, which advanced 11% year over year in the quarter under review. The top line outpaced the consensus mark by 0.7%.
Visa Inc. Price, Consensus and EPS Surprise
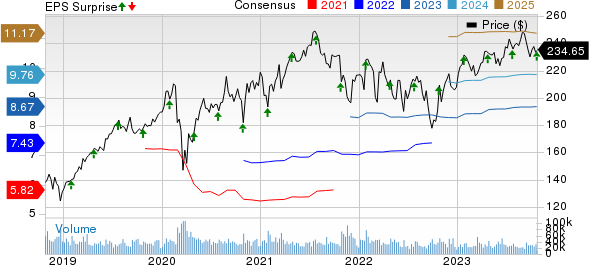
Visa Inc. price-consensus-eps-surprise-chart | Visa Inc. Quote
Q4 Business Drivers
Visa’s payments volume grew 9% year over year on a constant-dollar basis in the fiscal fourth quarter, backed by strength in Europe, CEMEA and LAC regions. Processed transactions (implying transactions processed by Visa) totaled 56 billion, which rose 10% year over year and beat our model estimate of 55.5 billion.
On a constant-dollar basis, the cross-border volume of Visa climbed 16% year over year in the quarter under review. Excluding transactions within Europe, its cross-border volume (that boosts a company’s international transaction revenues) advanced 18% year over year on a constant-dollar basis.
Q4 Operational Performance
Service revenues improved 12% year over year to $3.9 billion during the September quarter on the back of better payment volumes in the prior quarter. The metric was only 1.8% lower than our estimate. V’s data processing revenues of $4.3 billion grew 13% year over year in the quarter under review, beating our estimate of $4.2 billion.
International transaction revenues advanced 10% year over year to $3.2 billion, which met our estimate on higher cross-border volume. Other revenues of $744 million jumped 35% year over year and beat our estimate by 12.4%.
Client incentives (a contra-revenue item) of Visa escalated 20% year over year to $3.4 billion in the quarter under review and met our estimate. The metric amounted to 28.5% of the company’s gross revenues of $12 billion.
Total adjusted operating expenses of $2.9 billion increased 9% year over year and were marginally higher than our estimate of $2.8 billion. The increase was due to elevated personnel costs, network and processing, G&A and professional fees. Interest expense came in at $183 million, up 15.1% year over year.
Balance Sheet (as of Sep 30, 2023)
Visa exited the September quarter with cash and cash equivalents of $16.3 billion, which increased from the 2022 fiscal year-end level of $15.7 billion.
Total assets of $90.5 billion increased from the 2022 fiscal year-end level of $85.5 billion.
V’s long-term debt amounted to $20.5 billion, which inched up from the fiscal year-end level of $20.2 billion.
Total equity grew from the 2022 fiscal year-end level of $35.6 billion to $38.7 billion.
Cash Flows
Visa generated net cash from operations of $20.8 billion in fiscal 2023, which increased from $18.8 billion a year ago. Fiscal fourth-quarter free cash flows of $6.6 billion rose from $5.6 billion a year ago.
Capital Deployment Update
Visa rewarded $5 billion to shareholders via share buybacks of almost $4.1 billion and dividends of $928 million in the September quarter. V had authorized funds of $4.7 billion remaining under its share buyback program as of Sep 30, 2023. It also introduced a new repurchase program of $25 billion in October.
Management sanctioned a quarterly cash dividend of 52 cents per share (a 16% increase from the prior quarter), which will be paid out on Dec 1, 2023, to shareholders of record as of Nov 9, 2023.
Outlook
The company anticipates (non-GAAP) net revenue growth in fiscal 2024, ranging from high single digits to low double digits in nominal dollars. Non-GAAP operating expense for the year is expected to increase high single digit. Non-GAAP EPS growth in nominal dollars is expected in the low teens.
Amortization of acquired intangible assets is expected at $150 million or 6 cents per share. Acquisition-related costs are expected at around $80 million or 3 cents per share.
Zacks Rank & Key Picks
Visa currently has a Zacks Rank #3 (Hold).
Some better-ranked stocks in the broader Business Services space are Fidelity National Information Services, Inc. FIS, FirstCash Holdings, Inc. FCFS and WEX Inc. WEX, each carrying a Zacks Rank #2 (Buy) at present. You can see the complete list of today’s Zacks #1 Rank (Strong Buy) stocks here.
The Zacks Consensus Estimate for Fidelity National’s current year earnings is pegged at $5.93 per share, which increased 2 cents in the past week. Jacksonville, FL-based FIS beat earnings estimates in three of the past four quarters and missed once, with an average surprise of 3.1%.
The Zacks Consensus Estimate for FirstCash’s current year bottom line indicates 8.7% year-over-year growth. Headquartered in Fort Worth, TX, FCFS beat earnings estimates in all the past four quarters, with an average surprise of 7.3%.
The Zacks Consensus Estimate for WEX’s current year bottom line suggests 6.1% year-over-year growth. Based in Portland, ME, WEX beat earnings estimates in each of the past four quarters, with an average surprise of 4.1%.
Want the latest recommendations from Zacks Investment Research? Today, you can download 7 Best Stocks for the Next 30 Days. Click to get this free report
Visa Inc. (V) : Free Stock Analysis Report
Fidelity National Information Services, Inc. (FIS) : Free Stock Analysis Report
FirstCash Holdings, Inc. (FCFS) : Free Stock Analysis Report
WEX Inc. (WEX) : Free Stock Analysis Report
