W.R. Berkley (WRB) Q3 Earnings Top on Solid Underwriting

W.R. Berkley Corporation’s WRB third-quarter 2023 operating income of $1.35 per share beat the Zacks Consensus Estimate by 18.4%. The bottom line increased 33.7% year over year.
Shares gained 0.4% in the after-market trading session.
The insurer benefited from higher premiums, driven by strong rate increases in nearly all lines of business, exposure growth that fueled continued underwriting performance and a surge in investment income.
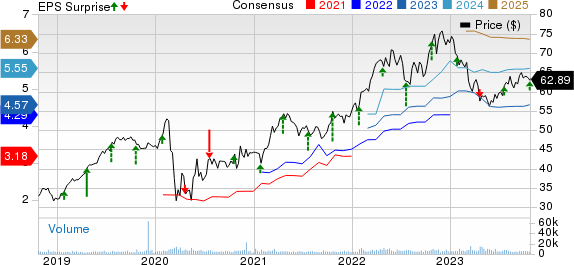
W.R. Berkley Corporation Price, Consensus and EPS Surprise
W.R. Berkley Corporation price-consensus-eps-surprise-chart | W.R. Berkley Corporation Quote
Behind the Headlines
W.R. Berkley’s net premiums written were a record $2.8 billion, up 10.5% year over year as market conditions remained favorable for most lines of business. The figure was in line with our estimate.
Operating revenues came in at $3.1 billion, up 3.4% year over year, on the back of higher net premiums earned and higher net investment income. The top line, however, beat the consensus estimate by 1.4%.
Net investment income surged 33.6% to a record $271 million, benefiting from higher yields. The Zacks Consensus Estimate for net investment income was $256 million, while our estimate was $257.9 million.
Total expenses increased 7.1% to $2.6 billion, primarily due to higher losses and loss expenses, other operating costs and expenses, expenses from non-insurance businesses and interest expenses. Our estimate was $2.6 billion.
The loss ratio improved 220 basis points (bps) to 62.6. Our estimate was pegged at 65.5. The expense ratio deteriorated 30 bps year over year to 28.4. The Zacks Consensus Estimate for the expense ratio was 28.5, while our estimate was 28.
Catastrophe losses totaled $61.5 million in the quarter. The consolidated combined ratio (a measure of underwriting profitability) improved 190 basis points to 90.2. The Zacks Consensus Estimate was 92. Our estimate for the combined ratio was 93.5.
Segment Details
Net premiums written at the Insurance segment increased 12.1% year over year to $2.5 billion in the quarter, primarily due to higher premiums from other liability, short-tail lines and commercial automobiles. Our estimate was $2.5 billion. The combined ratio improved by 20 bps to 91.1. Our estimate for the same was 92.
Net premiums written in the Reinsurance & Monoline Excess segment slightly increased year over year to $340 million on higher premiums at property reinsurance and monoline excess. Our estimate was $362.2 million. The combined ratio improved by 600 bps to 84.6 versus our estimate of 104.5.
Financial Update
W.R. Berkley exited the quarter with total assets worth $35.3 billion, up 6.8% from year-end 2022.
Senior notes and other debt dropped 0.04% from 2022 end levels to $1.8 billion.
Book value per share increased 5.1% from 2022 end levels to $26.80 as of Sep 30, 2023.
Cash flow from operations was $708.7 million in the reported quarter, up 40.3% year over year.
Operating return on equity expanded 480 bps to 21.7%.
Capital Deployment
WRB returned $160.3 million, consisting of $129 million in special dividends, $28.4 million in regular dividends and $2.9 million in share repurchases.
Zacks Rank
W.R. Berkley currently carries a Zacks Rank #3 (Hold). You can see the complete list of today’s Zacks #1 Rank (Strong Buy) stocks here.
Performance of Some Other P&C Insurers
The Travelers Companies TRV reported third-quarter 2023 core income of $1.95 per share, which missed the Zacks Consensus Estimate by 33.4%. The bottom line decreased 11.4% year over year, primarily attributable to higher catastrophe losses and net unfavorable prior-year reserve development. Travelers’ total revenues increased 14% from the year-ago quarter to $10.6 billion, primarily driven by higher premiums. The top-line figure beat the Zacks Consensus Estimate by 1.3%.
Net written premiums increased 14% year over year to a record $10.4 billion, driven by strong growth across all three segments. The figure was higher than our estimate of $9.4 billion. Travelers witnessed an underwriting gain of $868 million, up 43% year over year, driven by record net earned premiums of $9.7 billion and a consolidated underlying combined ratio, which improved by 90.6%.
The Progressive Corporation’s PGR third-quarter 2023 earnings per share of $2.09 beat the Zacks Consensus Estimate of $1.71. The bottom line improved more than fourfold year over year. Net premiums written were $15.6 billion in the quarter, which grew 20% from $13 billion a year ago and beat our estimate of $14.2 billion.
Net premiums earned grew 20% to $14.9 billion, beating our estimate of $13.6 billion and the Zacks Consensus Estimate of $14.8 billion. Net realized losses on securities were $149 million, narrower than a loss of $216.4 million in the year-ago quarter. The combined ratio — the percentage of premiums paid out as claims and expenses — improved 680 bps from the prior-year quarter’s level to 92.4.
RLI Corp. RLI reported third-quarter 2023 operating earnings of 61 cents per share, beating the Zacks Consensus Estimate by 510%. The bottom line improved 22% from the prior-year quarter. Operating revenues for the reported quarter were $350.4 million, up 12.1% year over year, driven by 9.2% higher net premiums earned and 50.3% higher net investment income. The top line, however, missed the Zacks Consensus Estimate by 7.2%.
Gross premiums written increased 11.3% year over year to $449.3 million. Underwriting income of $4.2 million decreased by 52.3%, primarily due to Hawaiian wildfire losses. The combined ratio deteriorated 170 basis points (bps) year over year to 98.7. Our estimate was 90.8.
Want the latest recommendations from Zacks Investment Research? Today, you can download 7 Best Stocks for the Next 30 Days. Click to get this free report
RLI Corp. (RLI) : Free Stock Analysis Report
The Travelers Companies, Inc. (TRV) : Free Stock Analysis Report
W.R. Berkley Corporation (WRB) : Free Stock Analysis Report
The Progressive Corporation (PGR) : Free Stock Analysis Report
