W&T Offshore (WTI) Q2 Earnings Lag Estimates, Revenues Fall Y/Y
W&T Offshore, Inc. WTI reported second-quarter 2023 adjusted loss (excluding one-time items) of 8 cents per share, missing the Zacks Consensus Estimate of an adjusted loss of 6 cents. The bottom line deteriorated from the year-ago quarter’s earnings of $1.32 per share.
Total quarterly revenues of $126 million missed the Zacks Consensus Estimate of $127 million. The top line also declined from $274 million in the prior-year quarter.
Lower oil equivalent production, rising expenses, and lower commodity price realizations led to weak quarterly results.
W&T Offshore, Inc. Price, Consensus and EPS Surprise
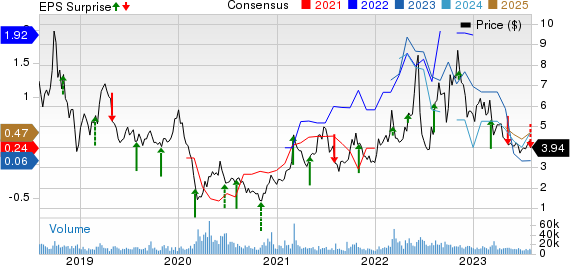
W&T Offshore, Inc. price-consensus-eps-surprise-chart | W&T Offshore, Inc. Quote
Production Statistics
The total production averaged 37 thousand barrels of oil equivalent per day (MBoe/d), down from the year-ago quarter’s 42.4 MBoe/d. The reported figures came in lower than our estimate of 38.6 MBoe/d.
Oil production was 1,254 thousand barrels (MBbls), down from the year-ago level of 1,476 MBbls, lower than our estimate of 1,315 MBbls. Natural gas liquids’ output totaled 443 MBbls, higher than 384 MBbls a year ago. In the reported quarter, natural gas production of 10,023 million cubic feet (MMcf) was lower than 11,995 MMcf in the year-earlier period, also lower than our estimate of 11,175 MMcf.
Realized Commodity Prices
The average realized price for oil in the second quarter was $71.76 a barrel, lower than the year-ago level of $107.9. Our estimate for the same was pegged at $71.14. The average realized price of NGL declined to $23.44 from $43.58 per barrel in the prior year, lower than our estimate of $26.81 per barrel. The average realized price of natural gas in the June quarter was $2.34 per thousand cubic feet, down from $7.70 in the last year’s comparable period. The average realized price for oil-equivalent output decreased to $36.76 per barrel from $69.55.
Operating Expenses
Lease operating expenses rose to $19.60 per Boe in the second quarter from $13.73 a year ago. The reported figures came in higher than our estimate of $18.23 per Boe. Also, general and administrative expenses increased to $5.16 per Boe from $3.88, higher than our estimate of $4.20 per Boe.
Cash Flow
Net cash from operations in the second quarter was $26.2 million, which declined from $210.2 million in the year-ago period.
Free cash flow in the reported quarter declined to $9.7 million from $233.5 million in the year-ago quarter.
Capital Spending & Balance Sheet
W&T Offshore spent $15.6 million in capital through the June quarter on oil and gas resources and equipment.
As of Jun 30, 2023, the company’s cash and cash equivalents were $171.6 million. Its net long-term debt in the quarter was $373 million. The current portion of the long-term debt is $30.6 million.
Guidance
For the third quarter of this year, W&T Offshore projects production in the band of 3,100 to 3,453 MBoe. For 2023, WTI expects production of 12,150 to 13,430 MBoe. Lease operating expenses for the third quarter are anticipated to be between $60-$67 million and $240-$260 million for the full year 2023.
Zacks Rank & Stocks to Consider
Currently, W&T Offshore carries a Zacks Rank #3 (Hold).
Some better-ranked stocks in the energy space are Evolution Petroleum Corporation EPM, Murphy USA Inc. MUSA and Crestwood Equity Partners LP CEQP. While EPM and MUSA sport a Zacks Rank #1 (Strong Buy), CEQP currently carries a Zacks Rank #2 (Buy). You can see the complete list of today’s Zacks #1 Rank stocks here.
Evolution Petroleum is touted as a key independent energy player through its ownership interests in onshore oil and natural gas properties in the United States.
Murphy USA serves 1.6 million customers daily and owns a dedicated line on the Colonial Pipeline. MUSA operates stations near Walmart supercenters and is a low-cost, high-volume fuel seller. This enables the company to attract significantly more transactions than its peers.
Headquartered in Houston, TX, Crestwood is a master limited partnership that provides a wide range of fee-based infrastructure solutions in major U.S. shale plays like the Bakken Shale, Delaware Basin, Powder River Basin, Marcellus Shale and others. The company is least exposed to commodity price fluctuations since it generates stable fee-based revenues from diverse midstream energy assets via long-term contracts.
Want the latest recommendations from Zacks Investment Research? Today, you can download 7 Best Stocks for the Next 30 Days. Click to get this free report
W&T Offshore, Inc. (WTI) : Free Stock Analysis Report
Murphy USA Inc. (MUSA) : Free Stock Analysis Report
Evolution Petroleum Corporation, Inc. (EPM) : Free Stock Analysis Report
Crestwood Equity Partners LP (CEQP) : Free Stock Analysis Report
