W.W. Grainger (GWW)'s True Worth: A Complete Analysis of Its Market Value
W.W. Grainger Inc (NYSE:GWW) experienced a daily gain of 2.41%, with a 3-month loss of -10%. Despite these fluctuations, the company's Earnings Per Share (EPS) stands at a robust 34.7. Given these figures, the question arises: is the stock modestly overvalued? To answer this, we delve into a comprehensive valuation analysis of the company. Read on to explore the intrinsic value of W.W. Grainger Inc (NYSE:GWW).
A Snapshot of W.W. Grainger Inc (NYSE:GWW)
W.W. Grainger distributes approximately 1.5 million maintenance, repair, and operating products sourced from over 4,500 suppliers. It caters to about 5 million customers through various channels, including online and electronic purchasing platforms, vending machines, catalog distribution, and a network of over 300 global branches. Notably, Grainger has invested significantly in its e-commerce capabilities, making it the 11th-largest e-retailer in North America.
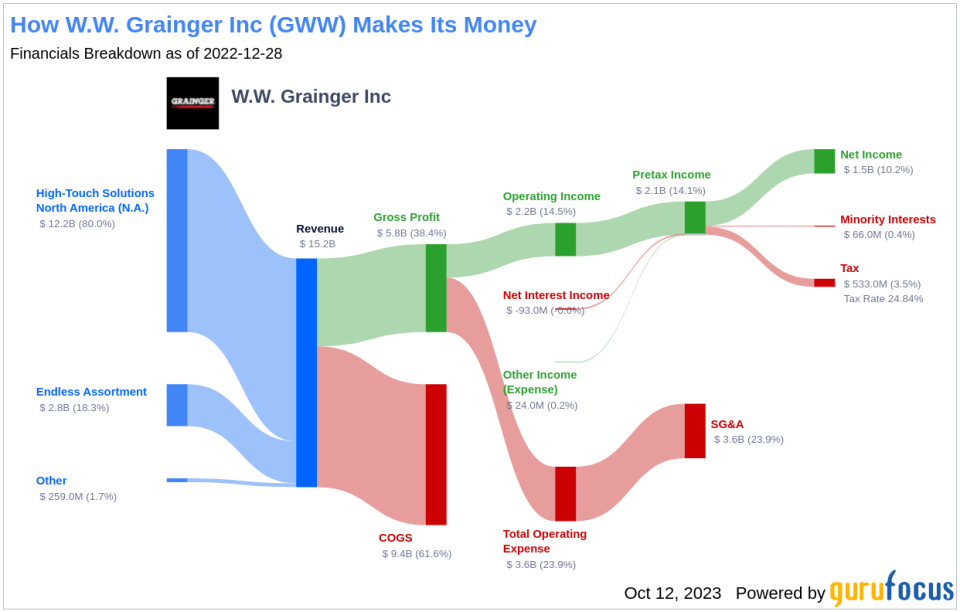
When comparing the stock price with the GF Value, an estimation of fair value, it appears that W.W. Grainger Inc (NYSE:GWW) may be modestly overvalued. The company's income breakdown provides further insights into its financial health:
Understanding the GF Value
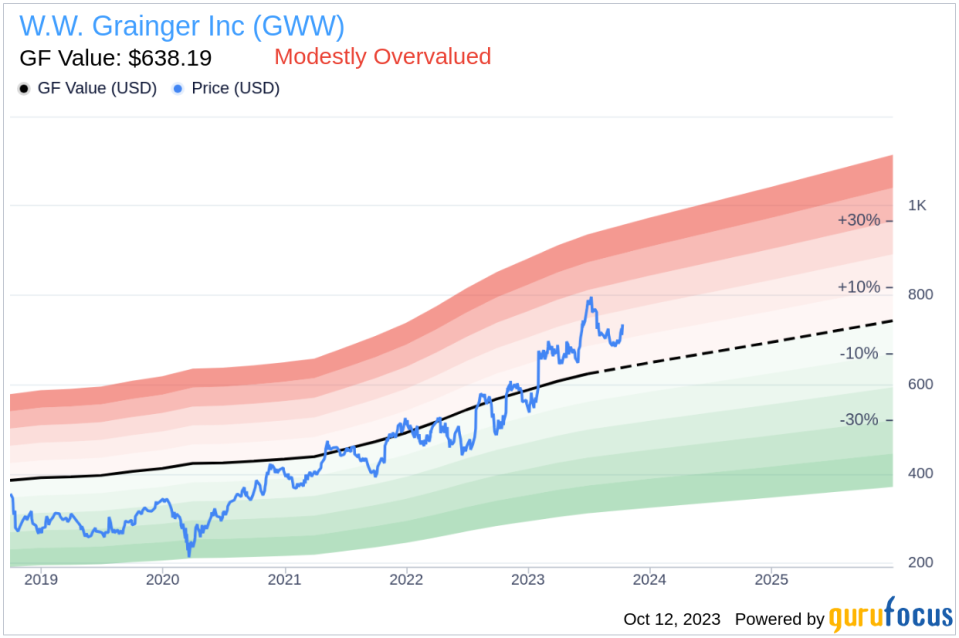
The GF Value is an exclusive measure of a stock's intrinsic value, computed based on historical trading multiples, a GuruFocus adjustment factor considering past performance and growth, and future business performance estimates. The GF Value Line represents the stock's ideal fair trading value.
W.W. Grainger (NYSE:GWW) appears to be modestly overvalued according to the GF Value method. The stock's fair value is estimated based on historical multiples, an internal adjustment reflecting past business growth, and analyst estimates of future performance. If the share price is significantly above the GF Value Line, the stock may be overvalued and could offer poor future returns. Conversely, if the share price is significantly below the GF Value Line, the stock may be undervalued and could provide higher future returns. With its current price of $731.54 per share, W.W. Grainger stock shows signs of being modestly overvalued.
Given that W.W. Grainger is relatively overvalued, the long-term return of its stock is likely to be lower than its business growth.
Link: These companies may deliver higher future returns at reduced risk.
Assessing W.W. Grainger's Financial Strength
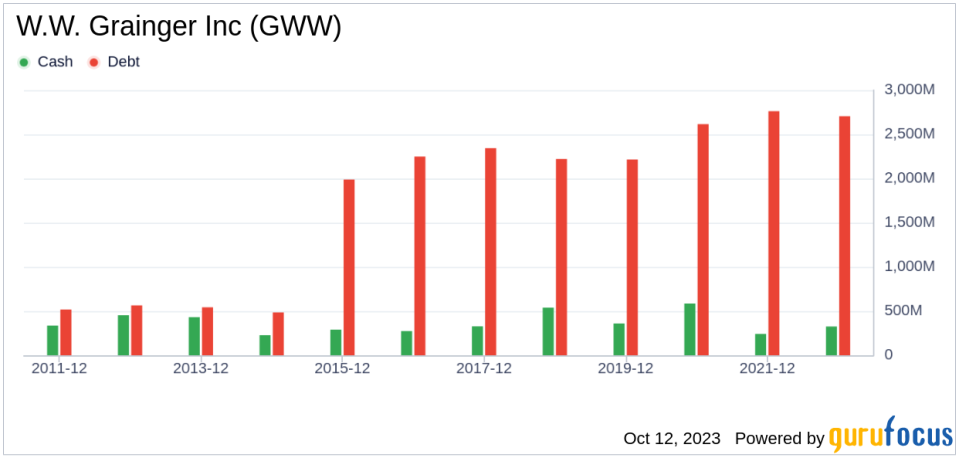
Before investing in a company, it's crucial to evaluate its financial strength. Companies with poor financial strength pose a higher risk of permanent loss. The cash-to-debt ratio and interest coverage provide valuable insights into a company's financial health. W.W. Grainger has a cash-to-debt ratio of 0.19, which is lower than 63.64% of 143 companies in the Industrial Distribution industry. The overall financial strength of W.W. Grainger is 7 out of 10, indicating fair financial health.
Profitability and Growth of W.W. Grainger
Companies that have consistently shown profitability over the long term offer less risk to investors. W.W. Grainger has been profitable for 10 out of the past 10 years. Over the past twelve months, the company had a revenue of $16 billion and an Earnings Per Share (EPS) of $34.7. Its operating margin is 15.53%, which ranks better than 92.47% of 146 companies in the Industrial Distribution industry. Overall, the profitability of W.W. Grainger is ranked 9 out of 10, indicating strong profitability.
One of the most important factors in the valuation of a company is growth. The average annual revenue growth of W.W. Grainger is12.5%, which ranks better than 65.96% of 141 companies in the Industrial Distribution industry. The 3-year average EBITDA growth is 20.3%, ranking better than 63.49% of 126 companies in the Industrial Distribution industry.
ROIC vs WACC
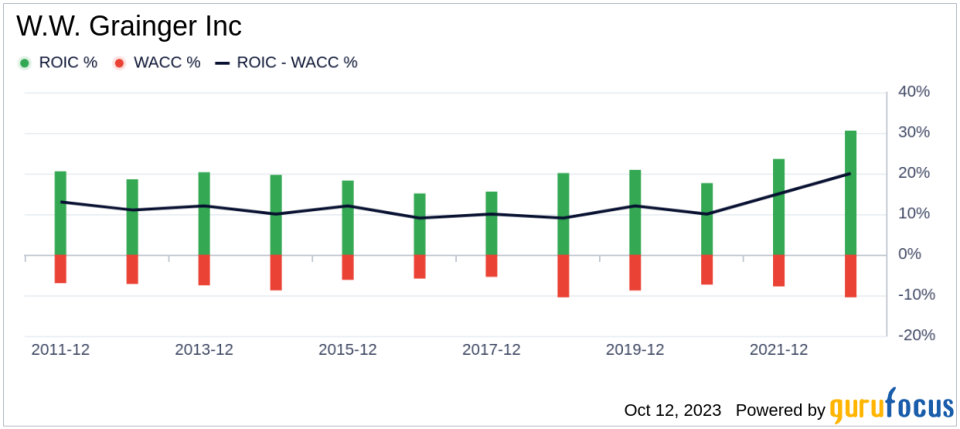
Comparing a company's return on invested capital (ROIC) to its weighted average cost of capital (WACC) can also evaluate its profitability. Return on invested capital (ROIC) measures how well a company generates cash flow relative to the capital it has invested in its business. The weighted average cost of capital (WACC) is the rate that a company is expected to pay on average to all its security holders to finance its assets. If the return on invested capital exceeds the weighted average cost of capital, the company is likely creating value for its shareholders. During the past 12 months, W.W. Grainger's ROIC was 33.36 while its WACC was 11.85.
Conclusion
In conclusion, the stock of W.W. Grainger (NYSE:GWW) shows every sign of being modestly overvalued. The company's financial condition is fair, and its profitability is strong. Its growth ranks better than 63.49% of 126 companies in the Industrial Distribution industry. To learn more about W.W. Grainger stock, you can check out its 30-Year Financials here.
To find out high-quality companies that may deliver above-average returns, please check out the GuruFocus High Quality Low Capex Screener.
This article, generated by GuruFocus, is designed to provide general insights and is not tailored financial advice. Our commentary is rooted in historical data and analyst projections, utilizing an impartial methodology, and is not intended to serve as specific investment guidance. It does not formulate a recommendation to purchase or divest any stock and does not consider individual investment objectives or financial circumstances. Our objective is to deliver long-term, fundamental data-driven analysis. Be aware that our analysis might not incorporate the most recent, price-sensitive company announcements or qualitative information. GuruFocus holds no position in the stocks mentioned herein.
This article first appeared on GuruFocus.
