W.W. Grainger's (NYSE:GWW) investors will be pleased with their stellar 266% return over the last five years
The worst result, after buying shares in a company (assuming no leverage), would be if you lose all the money you put in. But on a lighter note, a good company can see its share price rise well over 100%. One great example is W.W. Grainger, Inc. (NYSE:GWW) which saw its share price drive 240% higher over five years. It's also good to see the share price up 21% over the last quarter. This could be related to the recent financial results, released recently - you can catch up on the most recent data by reading our company report.
Now it's worth having a look at the company's fundamentals too, because that will help us determine if the long term shareholder return has matched the performance of the underlying business.
See our latest analysis for W.W. Grainger
While markets are a powerful pricing mechanism, share prices reflect investor sentiment, not just underlying business performance. One flawed but reasonable way to assess how sentiment around a company has changed is to compare the earnings per share (EPS) with the share price.
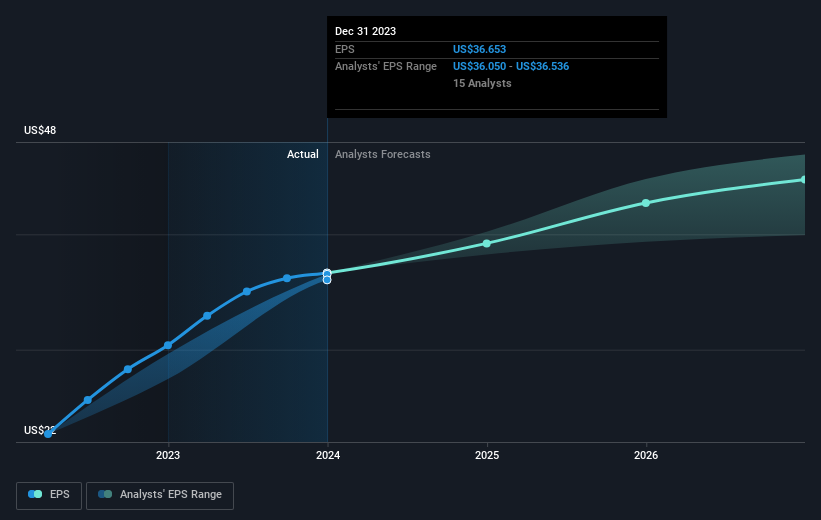
During five years of share price growth, W.W. Grainger achieved compound earnings per share (EPS) growth of 22% per year. This EPS growth is slower than the share price growth of 28% per year, over the same period. This suggests that market participants hold the company in higher regard, these days. And that's hardly shocking given the track record of growth.
The image below shows how EPS has tracked over time (if you click on the image you can see greater detail).
It is of course excellent to see how W.W. Grainger has grown profits over the years, but the future is more important for shareholders. If you are thinking of buying or selling W.W. Grainger stock, you should check out this FREE detailed report on its balance sheet.
What About Dividends?
As well as measuring the share price return, investors should also consider the total shareholder return (TSR). The TSR is a return calculation that accounts for the value of cash dividends (assuming that any dividend received was reinvested) and the calculated value of any discounted capital raisings and spin-offs. So for companies that pay a generous dividend, the TSR is often a lot higher than the share price return. We note that for W.W. Grainger the TSR over the last 5 years was 266%, which is better than the share price return mentioned above. And there's no prize for guessing that the dividend payments largely explain the divergence!
A Different Perspective
It's nice to see that W.W. Grainger shareholders have received a total shareholder return of 51% over the last year. That's including the dividend. Since the one-year TSR is better than the five-year TSR (the latter coming in at 30% per year), it would seem that the stock's performance has improved in recent times. Given the share price momentum remains strong, it might be worth taking a closer look at the stock, lest you miss an opportunity. I find it very interesting to look at share price over the long term as a proxy for business performance. But to truly gain insight, we need to consider other information, too. For example, we've discovered 1 warning sign for W.W. Grainger that you should be aware of before investing here.
If you would prefer to check out another company -- one with potentially superior financials -- then do not miss this free list of companies that have proven they can grow earnings.
Please note, the market returns quoted in this article reflect the market weighted average returns of stocks that currently trade on American exchanges.
Have feedback on this article? Concerned about the content? Get in touch with us directly. Alternatively, email editorial-team (at) simplywallst.com.
This article by Simply Wall St is general in nature. We provide commentary based on historical data and analyst forecasts only using an unbiased methodology and our articles are not intended to be financial advice. It does not constitute a recommendation to buy or sell any stock, and does not take account of your objectives, or your financial situation. We aim to bring you long-term focused analysis driven by fundamental data. Note that our analysis may not factor in the latest price-sensitive company announcements or qualitative material. Simply Wall St has no position in any stocks mentioned.
