Warren Buffett's $168 Billion Silent Warning to Wall Street Shouldn't Be Ignored
For nearly six decades, Berkshire Hathaway (NYSE: BRK.A)(NYSE: BRK.B) CEO Warren Buffett has been running circles around Wall Street's benchmark stock index, the S&P 500 (SNPINDEX: ^GSPC). Whereas the S&P 500 has delivered a hearty aggregate total return, including dividends, of around 34,200% since the mid-1960s, the Oracle of Omaha has overseen a stunning 5,074,030% aggregate increase in his company's Class A shares (BRK.A) since becoming CEO.
Despite being as fallible as any other investor, Warren Buffett and his investment team have demonstrated a skill for finding amazing values hiding in plain sight. He and his team typically seek out businesses that offer sustained competitive advantages and have rock-solid management teams.
Because of the Oracle of Omaha's overwhelming success as a money manager, professional and everyday investors have a tendency to ride his coattails to big gains. Quarterly filed Form 13Fs with the Securities and Exchange Commission allow investors to see what Buffett and his aides have been buying and selling.
But sometimes it's the actions not taken that speak the loudest.
Warren Buffett's $168 billion glaring warning to Wall Street
Roughly one month ago, Berkshire Hathaway announced its fourth-quarter and full-year results for 2023. It was businesses as usual for the Oracle of Omaha's company, with operating earnings rising about $6.5 billion to $37.4 billion from the prior-year period. While Berkshire may be best-known for its $376 billion investment portfolio containing 45 stocks and two index funds, it also owns around five dozen businesses, such as insurer GEICO and railroad BNSF, which have steadily grown over time.
But what arguably stands out most about Berkshire Hathaway's quarterly report is what didn't happen.
In each of the past five quarters (beginning Oct. 1, 2022), Buffett and his investment "lieutenants," Ted Weschler and Todd Combs, have been net-sellers of equities. In other words, they've been selling more stock than they've been buying over the past 15 months, to the aggregate tune of nearly $39 billion.
Generating positive cash flow from operations, coupled with being a consistent net-sellers of equities, has resulted in Berkshire Hathaway's cash pile swelling to an all-time high of $167.6 billion.
Generally speaking, a large cash pile is viewed favorably by the investment community. Having a lot of cash on hand gives most businesses enviable financial flexibility with regard to innovation, capital returns, and acquisitions.
But Berkshire Hathaway isn't your run-of-the-mill company. Buffett and his team have counted on investing Berkshire's capital to complement operating earnings growth and drive investment gains for decades. In short, a rapidly rising cash pile suggests that Warren Buffett isn't finding any worthwhile businesses to invest his company's capital. This unwillingness to put his company's capital to work is a silent warning that investors shouldn't ignore.
Stocks are historically pricey
Although the Oracle of Omaha would never bet against America, Berkshire's growing cash pile suggests he won't bet on stocks if the valuation isn't right, either.
Though there is no shortage of ways to analyze valuations on Wall Street, the S&P 500's Shiller price-to-earnings (P/E) ratio, which is also known as the cyclically adjusted price-to-earnings ratio (CAPE ratio), is one of the best.
Instead of using trailing-12-month earnings, as with the traditional P/E ratio, the Shiller P/E is based on average inflation-adjusted earnings from the past 10 years. Looking at a decade of trailing, inflation-adjusted earnings removes one-time events (e.g., the COVID-19 pandemic) that can skew traditional valuation analysis.
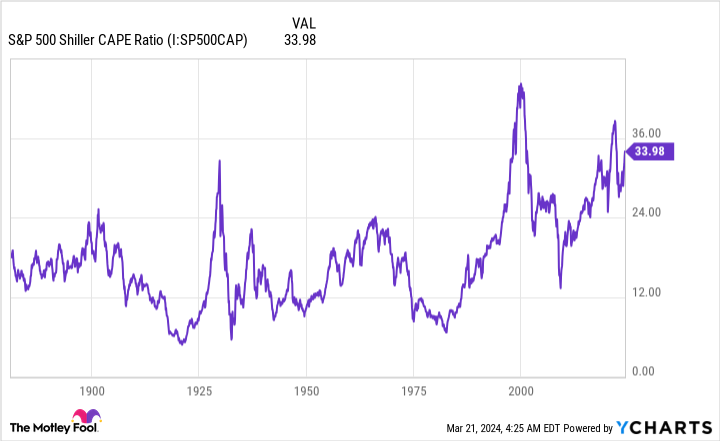
When back-tested to 1871, the S&P Shiller P/E ratio has averaged a modest 17.1 multiple. As of the closing bell on March 20, 2024, the S&P 500's Shiller P/E was just shy of 35. This is one of the highest readings in history during a bull market.
But what's noteworthy is what's happened throughout history anytime the Shiller P/E has crossed above 30 and held that mark for any notable length of time. In the five previous instances this has occurred, dating back to 1871, the Dow Jones Industrial Average or S&P 500 eventually went on to lose between 20% and 89% of their value. The takeaway being that extended valuations always, eventually, revert closer to the mean.
To be fair, the Shiller P/E ratio isn't a timing tool. For instance, it remained above 30 for four years between 1997 and 2001 before the dot-com bubble put a hurting on richly valued growth stocks. Just because it's near 35 now doesn't mean a downturn for the stock market is in the cards anytime soon. But history does suggest an eventual bear market swoon awaits.
While Buffett hasn't singled out any specific valuation tool for stocks, his latest annual letter to shareholders did note that "For whatever reason, markets now exhibit far more casino-like behavior than they did when I was young." A renowned investor describing the stock market as a "casino" suggests value is extremely hard to find at the moment.

Patience and perspective will always trump market timing
Despite the Oracle of Omaha's candidness about Wall Street's "casino," Warren Buffett has also been clear on numerous occasions throughout his tenure as Berkshire Hathaway CEO that he'd never bet against America. Buffett understands better than most investors that patience and perspective matter far more than trying to time short-term directional moves in stocks.
For example, economic slowdowns and recessions are a normal part of the economic cycle. Even though Buffett and his investment team are fully aware that a U.S. recession is going to materialize at some point in the future, they understand that there's a far greater incentive to bet on economic expansion.
Since the end of World War II, there have been a dozen U.S. recessions, nine of which resolved in less than a year. The remaining three failed to surpass 18 months. Comparatively, most periods of growth stuck around for multiple years, with two expansions surpassing the 10-year mark. While skeptics will be right from time to time, betting on the steady long-term expansion of the U.S. economy and its underlying businesses has been a winning formula.
This imbalance between the length of expansions and recessions is also visible in the stock market. Although stocks don't mirror the performance of the U.S. economy, corporate earnings usually ebb-and-flow with the health of the economy.
It's official. A new bull market is confirmed.
The S&P 500 is now up 20% from its 10/12/22 closing low. The prior bear market saw the index fall 25.4% over 282 days.
Read more at https://t.co/H4p1RcpfIn. pic.twitter.com/tnRz1wdonp-- Bespoke (@bespokeinvest) June 8, 2023
Last June, the researchers at Bespoke Investment Group released a data set that examined the length of every bear and bull market in the S&P 500 since the start of the Great Depression in September 1929. All told, 27 separate bear and bull markets were analyzed.
What Bespoke's data showed was that the average bear market hung around for 286 calendar days, or roughly 9.5 months. On the flipside, the typical bull market has lasted 1,011 calendar days over the past 94 years, or approximately 3.5 times longer than the average bear market. In fact, 13 of the 27 bull markets studied by Bespoke have lasted longer than the lengthiest bear market.
Buffett's growing cash pile is a clear yet silent admission that neither he nor his team sees much in the way of value. But that doesn't mean Buffett has given up on America or the stock market that's brought him and his shareholders immense wealth.
For more than a half-century, Buffett has used Berkshire's treasure chest as a tool to scoop up generational values at bargain prices. Though no one knows when this opportunity will next arise or what stock(s) will pique the interest of the Oracle of Omaha and his investment aides, it's a veritable certainty that, at some point in the future, a meaningful portion of Berkshire's $168 billion cash pile will be put to work.
Should you invest $1,000 in Berkshire Hathaway right now?
Before you buy stock in Berkshire Hathaway, consider this:
The Motley Fool Stock Advisor analyst team just identified what they believe are the 10 best stocks for investors to buy now… and Berkshire Hathaway wasn’t one of them. The 10 stocks that made the cut could produce monster returns in the coming years.
Stock Advisor provides investors with an easy-to-follow blueprint for success, including guidance on building a portfolio, regular updates from analysts, and two new stock picks each month. The Stock Advisor service has more than tripled the return of S&P 500 since 2002*.
*Stock Advisor returns as of March 21, 2024
Sean Williams has no position in any of the stocks mentioned. The Motley Fool has positions in and recommends Berkshire Hathaway. The Motley Fool has a disclosure policy.
Warren Buffett's $168 Billion Silent Warning to Wall Street Shouldn't Be Ignored was originally published by The Motley Fool
