Watkin Jones (LON:WJG) shareholders have endured a 56% loss from investing in the stock five years ago
Generally speaking long term investing is the way to go. But that doesn't mean long term investors can avoid big losses. For example, after five long years the Watkin Jones Plc (LON:WJG) share price is a whole 64% lower. That is extremely sub-optimal, to say the least. We also note that the stock has performed poorly over the last year, with the share price down 64%. More recently, the share price has dropped a further 24% in a month. This could be related to the recent financial results - you can catch up on the most recent data by reading our company report.
So let's have a look and see if the longer term performance of the company has been in line with the underlying business' progress.
View our latest analysis for Watkin Jones
While the efficient markets hypothesis continues to be taught by some, it has been proven that markets are over-reactive dynamic systems, and investors are not always rational. One imperfect but simple way to consider how the market perception of a company has shifted is to compare the change in the earnings per share (EPS) with the share price movement.
Looking back five years, both Watkin Jones' share price and EPS declined; the latter at a rate of 7.0% per year. This reduction in EPS is less than the 19% annual reduction in the share price. So it seems the market was too confident about the business, in the past. The low P/E ratio of 7.18 further reflects this reticence.
You can see how EPS has changed over time in the image below (click on the chart to see the exact values).
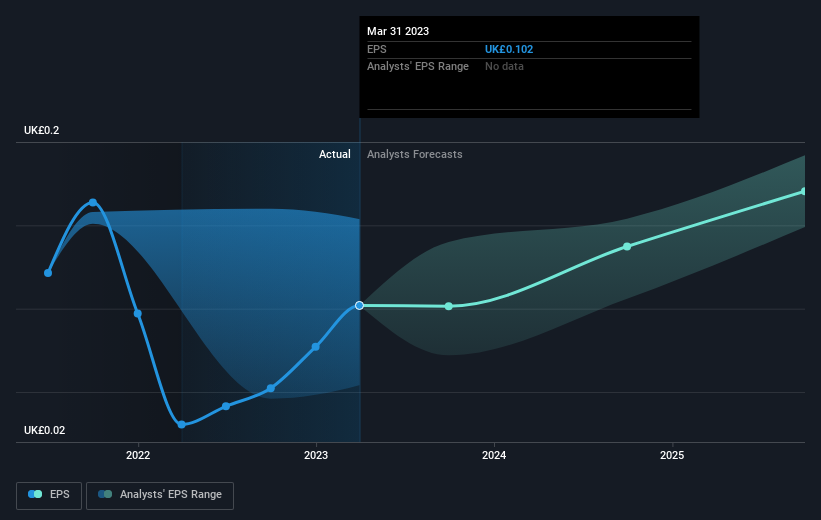
We like that insiders have been buying shares in the last twelve months. Even so, future earnings will be far more important to whether current shareholders make money. Dive deeper into the earnings by checking this interactive graph of Watkin Jones' earnings, revenue and cash flow.
What About Dividends?
As well as measuring the share price return, investors should also consider the total shareholder return (TSR). The TSR incorporates the value of any spin-offs or discounted capital raisings, along with any dividends, based on the assumption that the dividends are reinvested. So for companies that pay a generous dividend, the TSR is often a lot higher than the share price return. We note that for Watkin Jones the TSR over the last 5 years was -56%, which is better than the share price return mentioned above. And there's no prize for guessing that the dividend payments largely explain the divergence!
A Different Perspective
Watkin Jones shareholders are down 62% for the year (even including dividends), but the market itself is up 8.0%. However, keep in mind that even the best stocks will sometimes underperform the market over a twelve month period. Unfortunately, last year's performance may indicate unresolved challenges, given that it was worse than the annualised loss of 9% over the last half decade. Generally speaking long term share price weakness can be a bad sign, though contrarian investors might want to research the stock in hope of a turnaround. It's always interesting to track share price performance over the longer term. But to understand Watkin Jones better, we need to consider many other factors. Take risks, for example - Watkin Jones has 2 warning signs we think you should be aware of.
If you like to buy stocks alongside management, then you might just love this free list of companies. (Hint: insiders have been buying them).
Please note, the market returns quoted in this article reflect the market weighted average returns of stocks that currently trade on British exchanges.
Have feedback on this article? Concerned about the content? Get in touch with us directly. Alternatively, email editorial-team (at) simplywallst.com.
This article by Simply Wall St is general in nature. We provide commentary based on historical data and analyst forecasts only using an unbiased methodology and our articles are not intended to be financial advice. It does not constitute a recommendation to buy or sell any stock, and does not take account of your objectives, or your financial situation. We aim to bring you long-term focused analysis driven by fundamental data. Note that our analysis may not factor in the latest price-sensitive company announcements or qualitative material. Simply Wall St has no position in any stocks mentioned.
Join A Paid User Research Session
You’ll receive a US$30 Amazon Gift card for 1 hour of your time while helping us build better investing tools for the individual investors like yourself. Sign up here
