Watkin Jones Plc (AIM:WJG) Delivered A Better ROE Than The Industry, Here’s Why

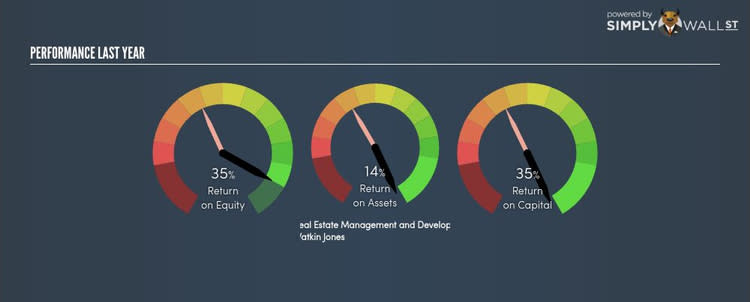
With an ROE of 35.07%, Watkin Jones Plc (AIM:WJG) outpaced its own industry which delivered a less exciting 12.08% over the past year. On the surface, this looks fantastic since we know that WJG has made large profits from little equity capital; however, ROE doesn’t tell us if management have borrowed heavily to make this happen. In this article, we’ll closely examine some factors like financial leverage to evaluate the sustainability of WJG’s ROE. See our latest analysis for WJG
Breaking down Return on Equity
Return on Equity (ROE) is a measure of WJG’s profit relative to its shareholders’ equity. An ROE of 35.07% implies £0.35 returned on every £1 invested. Generally speaking, a higher ROE is preferred; however, there are other factors we must also consider before making any conclusions.
Return on Equity = Net Profit ÷ Shareholders Equity
ROE is assessed against cost of equity, which is measured using the Capital Asset Pricing Model (CAPM) – but let’s not dive into the details of that today. For now, let’s just look at the cost of equity number for WJG, which is 8.30%. Since WJG’s return covers its cost in excess of 26.77%, its use of equity capital is efficient and likely to be sustainable. Simply put, WJG pays less for its capital than what it generates in return. ROE can be broken down into three different ratios: net profit margin, asset turnover, and financial leverage. This is called the Dupont Formula:
Dupont Formula
ROE = profit margin × asset turnover × financial leverage
ROE = (annual net profit ÷ sales) × (sales ÷ assets) × (assets ÷ shareholders’ equity)
ROE = annual net profit ÷ shareholders’ equity
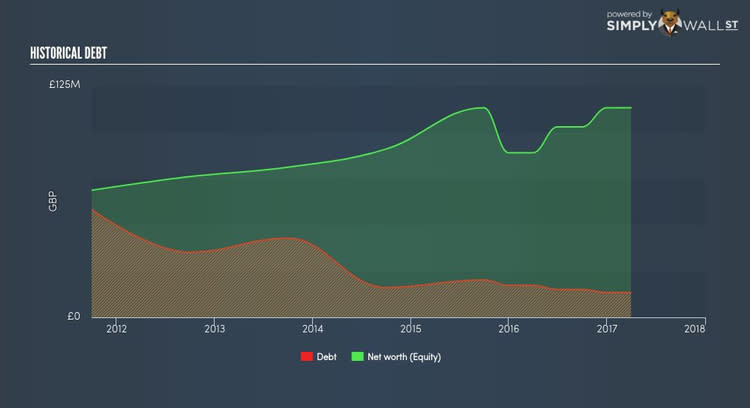
The first component is profit margin, which measures how much of sales is retained after the company pays for all its expenses. Asset turnover reveals how much revenue can be generated from WJG’s asset base. And finally, financial leverage is simply how much of assets are funded by equity, which exhibits how sustainable WJG’s capital structure is. Since financial leverage can artificially inflate ROE, we need to look at how much debt WJG currently has. The debt-to-equity ratio currently stands at a low 11.91%, meaning the above-average ROE is due to its capacity to produce profit growth without a huge debt burden.
What this means for you:
Are you a shareholder? WJG exhibits a strong ROE against its peers, as well as sufficient returns to cover its cost of equity. Since its high ROE is not likely driven by high debt, it might be a good time to top up on your current holdings if your fundamental research reaffirms this analysis. If you’re looking for new ideas for high-returning stocks, you should take a look at our free platform to see the list of stocks with Return on Equity over 20%.
Are you a potential investor? If you are considering investing in WJG, basing your decision on ROE alone is certainly not sufficient. I recommend you do additional fundamental analysis by looking through our most recent infographic report on Watkin Jones to help you make a more informed investment decision.
To help readers see pass the short term volatility of the financial market, we aim to bring you a long-term focused research analysis purely driven by fundamental data. Note that our analysis does not factor in the latest price sensitive company announcements.
The author is an independent contributor and at the time of publication had no position in the stocks mentioned.
